

Log Analytics Workspace
- 05 Aug 2026
- 5 Minutes to read
- Print
- DarkLight
- Download PDF
Log Analytics Workspace
- Updated on 05 Aug 2026
- 5 Minutes to read
- Print
- DarkLight
- Download PDF
Article summary
Did you find this summary helpful?
Thank you for your feedback!
Overview
Log Analytics Workspace is a logical storage unit in Azure that stores all log data from Azure Monitors, simplifying the management of log data collected from various data sources such as Azure Virtual Machines. Azure log analytics can be used to query and retrieve data from multiple monitor logs that meet certain criteria to provide better insights into the data.
Business value
Running and monitoring Log Analytics queries from Turbo360 gives you a single place to investigate log data and build custom dashboards, reducing the time to diagnose operational issues across your Azure resources.
How it works
- Once associated with a Business Application, the workspace's queries, dashboards, and monitoring become directly manageable from Turbo360.
- A time range filter can be applied to queries to retrieve the subset of required data, either within the query itself or through the time range filter.
Permissions
Access to Log Analytics Workspace actions is controlled through RBAC when adding a role to a Business Application.
| Permission | Description |
|---|---|
| Read | View workspace details, run queries, and view the resource dashboard. |
| Manage | Save and edit queries, configure query widgets, and configure monitoring rules. |
Operations
Turbo360 lets you run, save, and visualize Log Analytics queries directly from the resource, without switching to the Azure portal.
Running queries
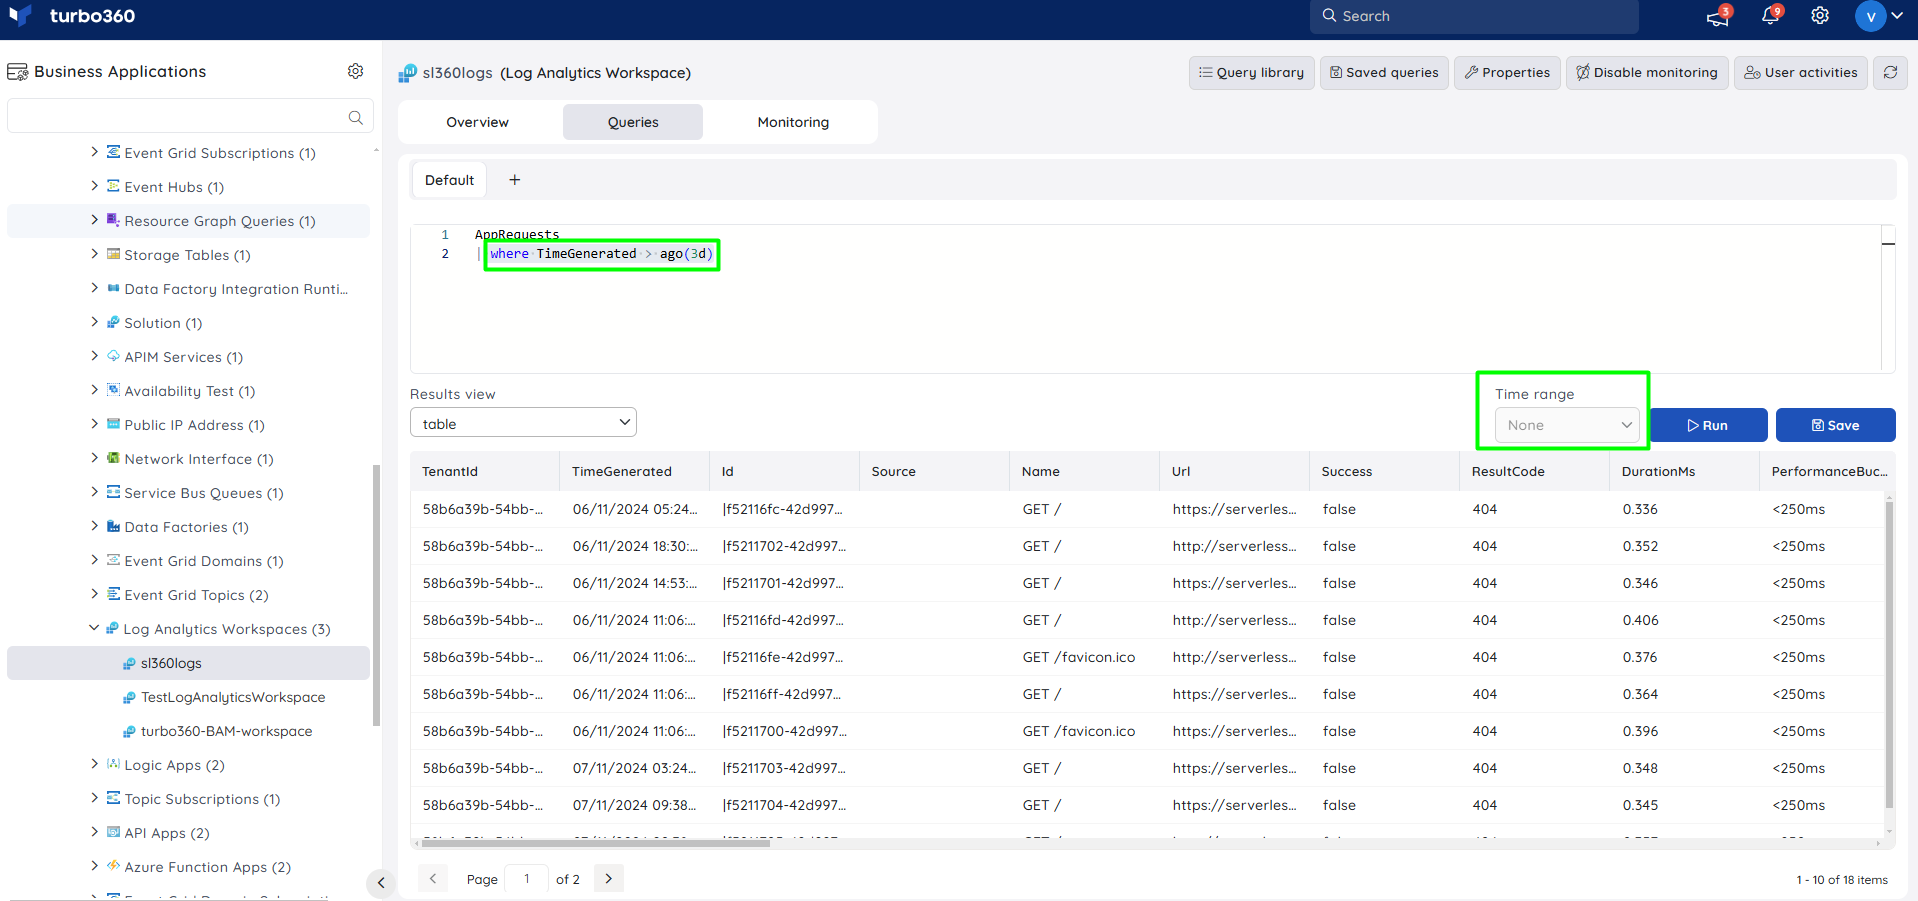
- Execute query — write a query in the Query field to generate query data. Use this when you need to investigate log data for a specific scenario.
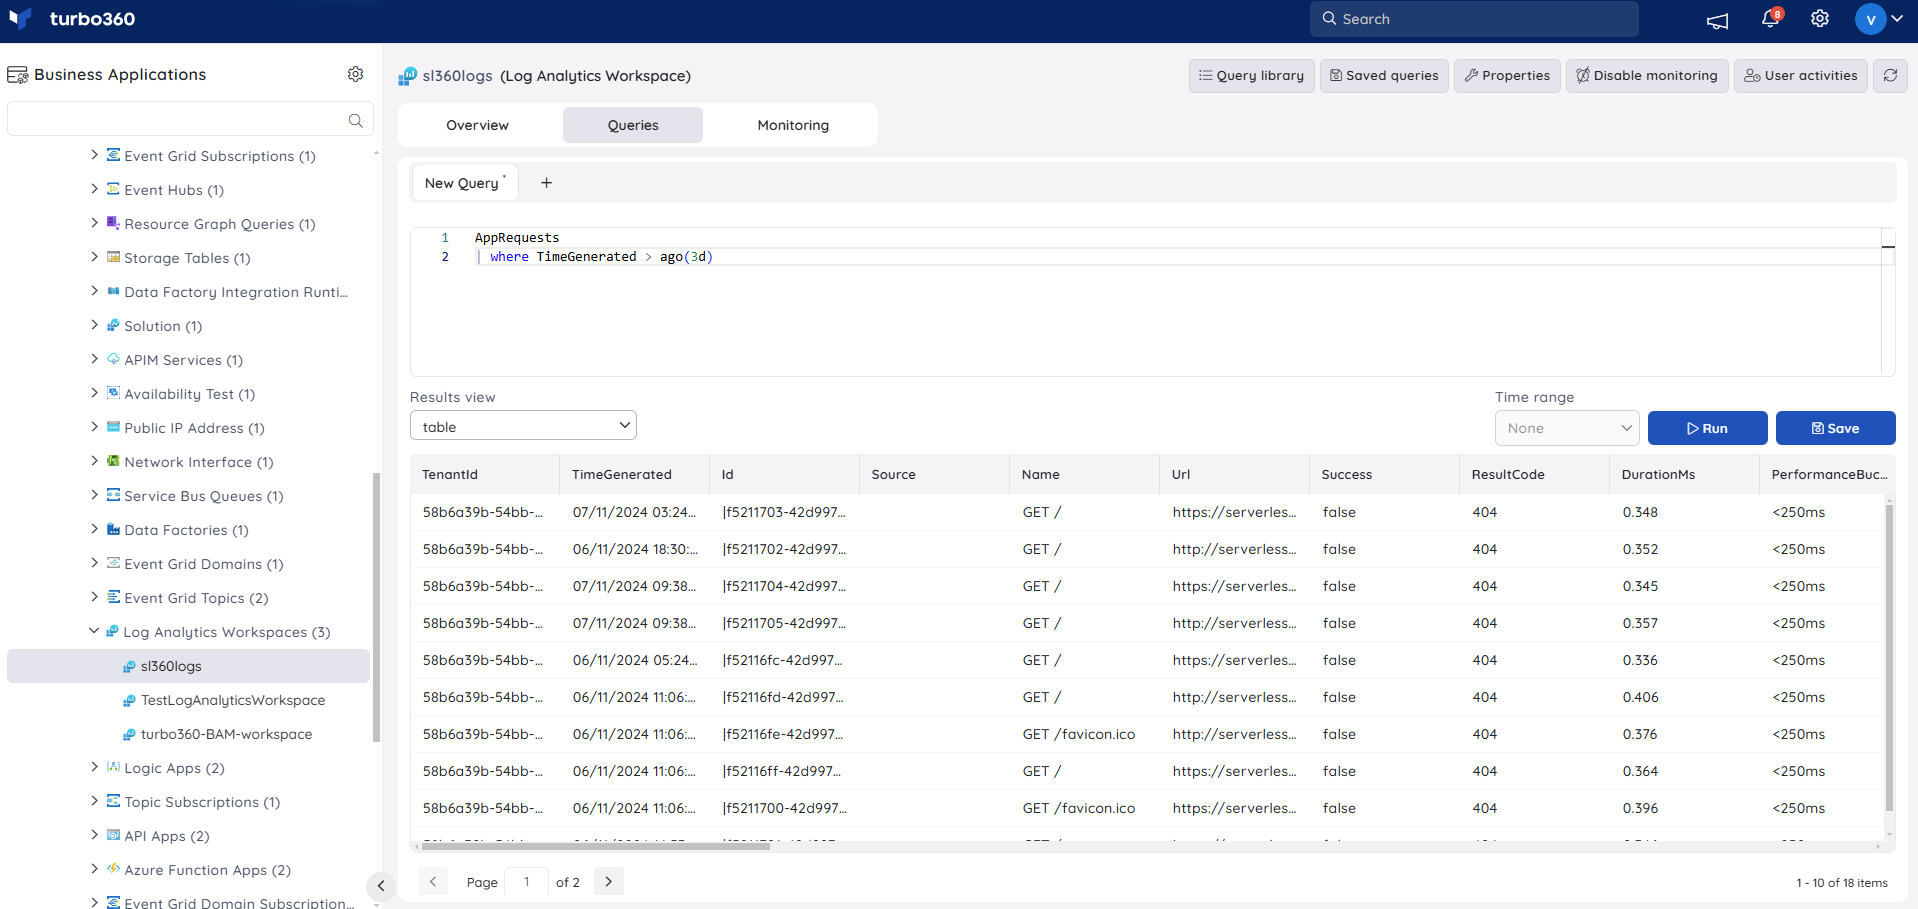
Query data can be viewed in any of the available formats: table, line, bar, column, donut, or area.
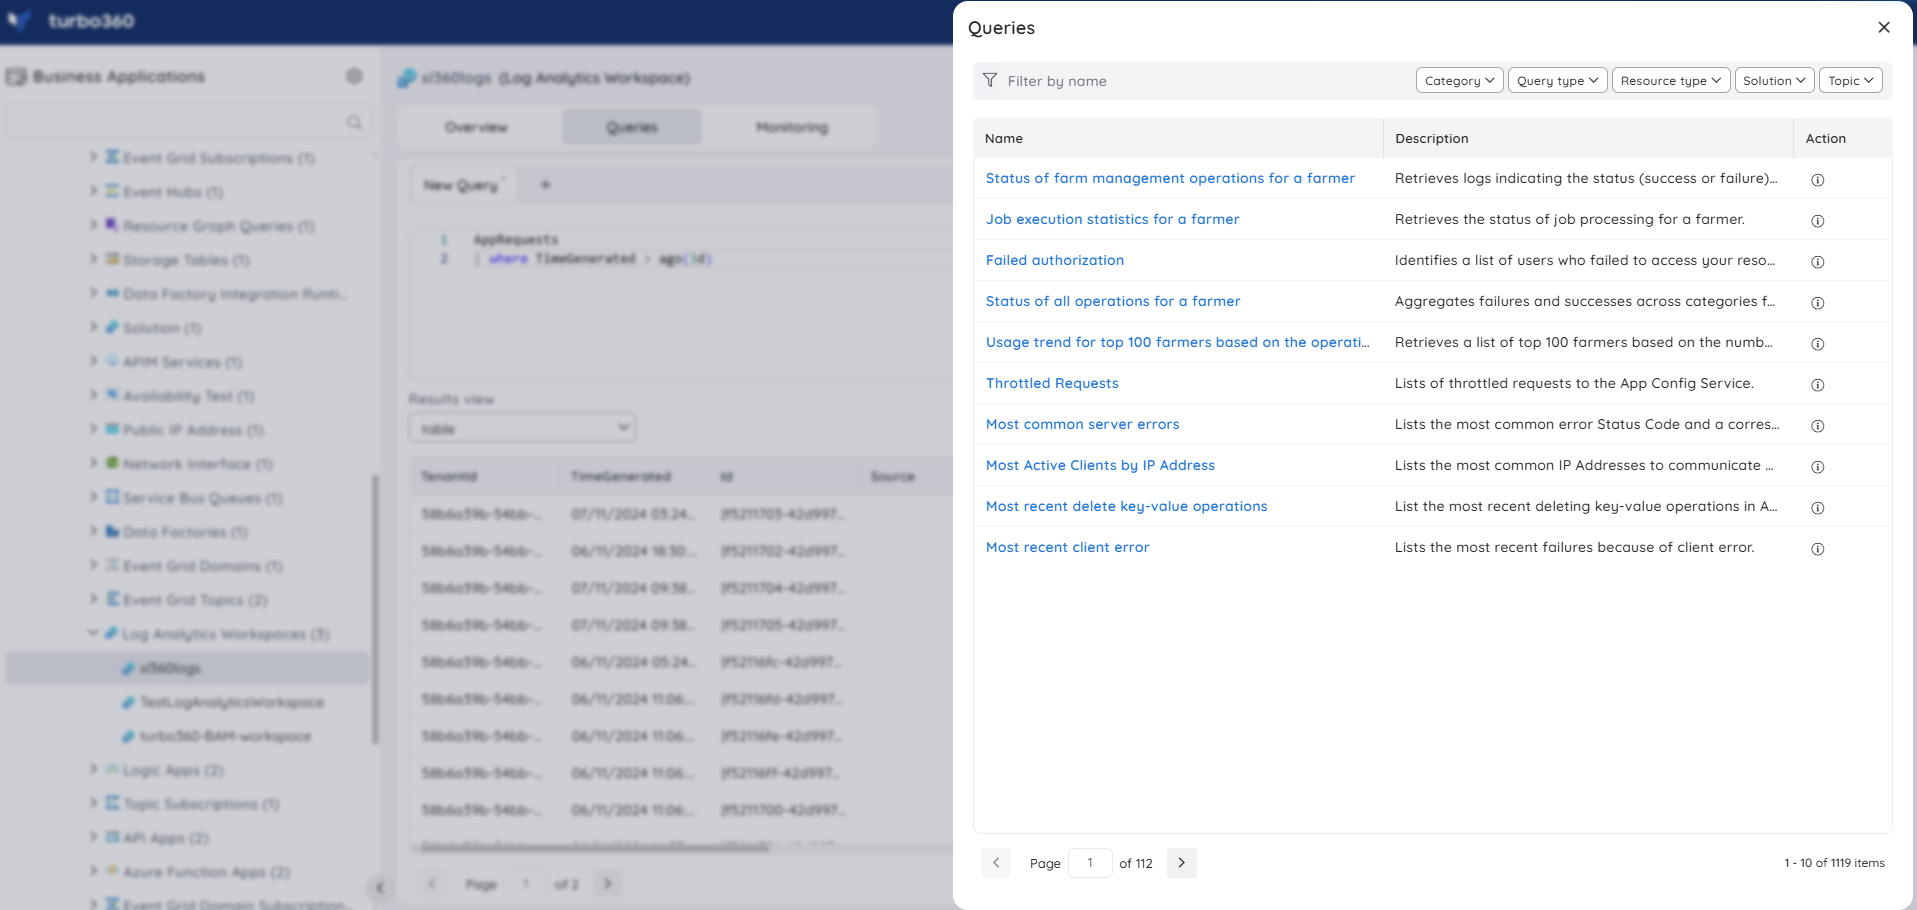
- Query library — access preset queries from the Azure portal directly in Turbo360, using the Save icon on each query to add it to your saved queries. Use this when you want to start from a known-good query rather than writing one from scratch.
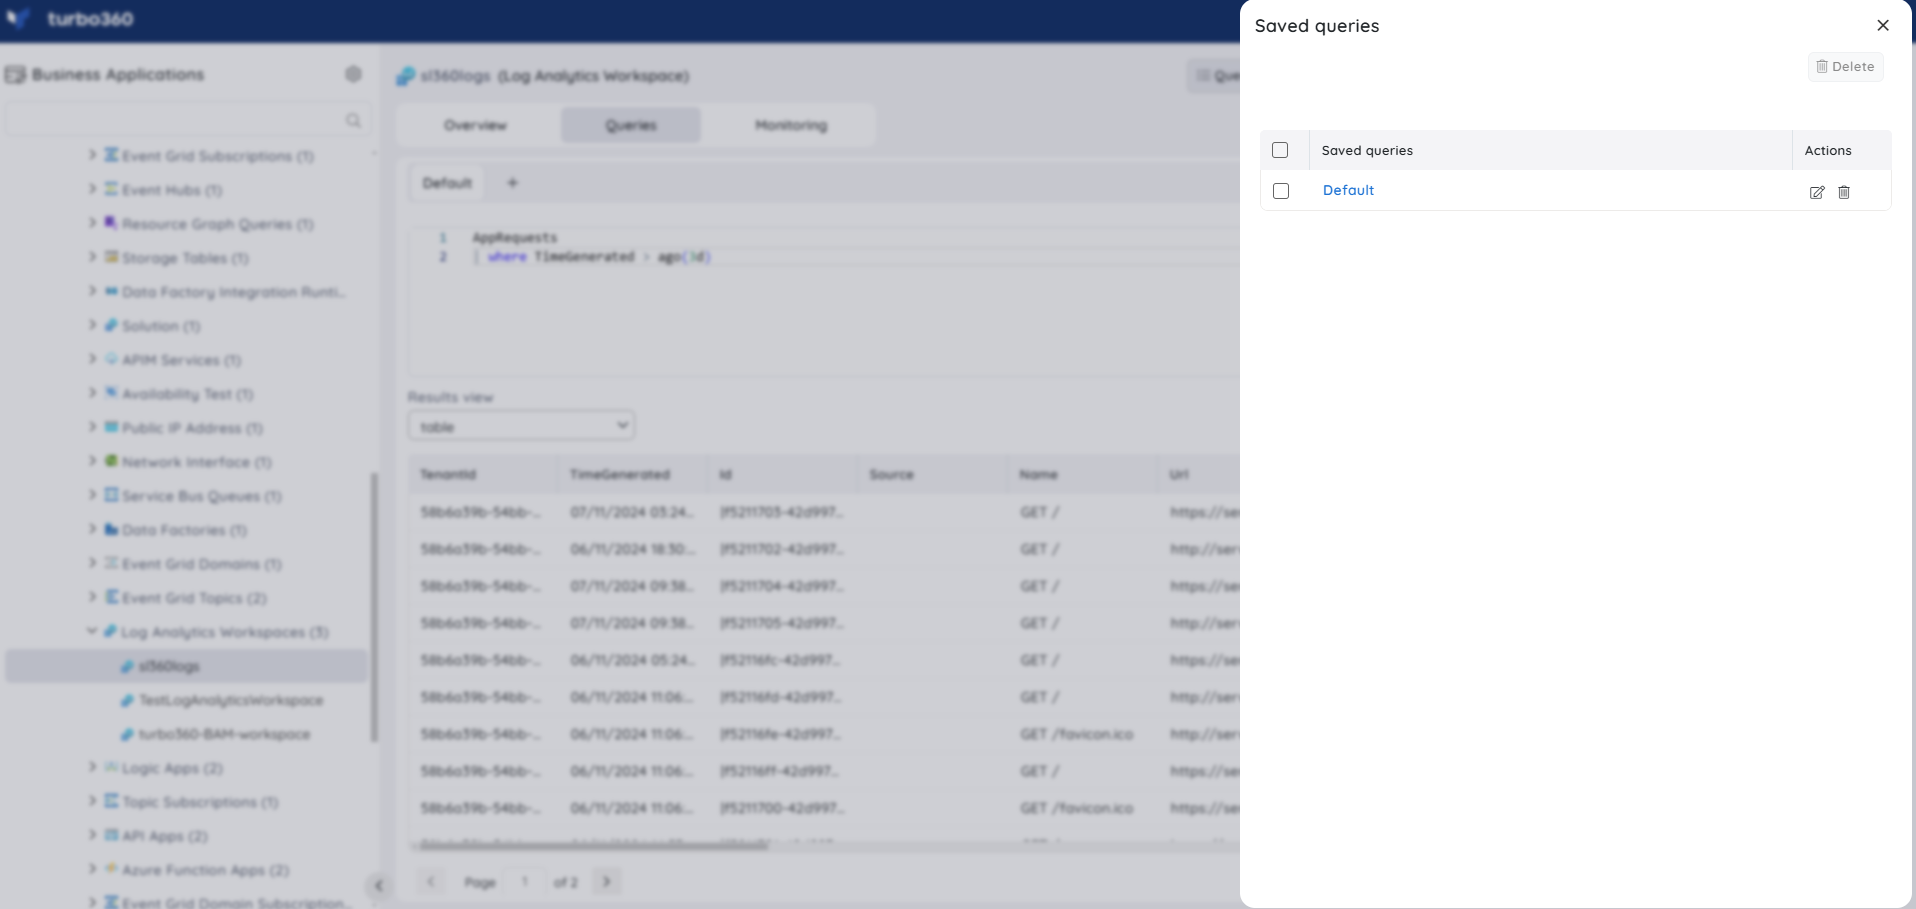
- Saved queries — access all saved queries from the Queries tab to generate query data, edit a saved query, or update the favorite query. Use this when the same query is run repeatedly during monitoring or troubleshooting.
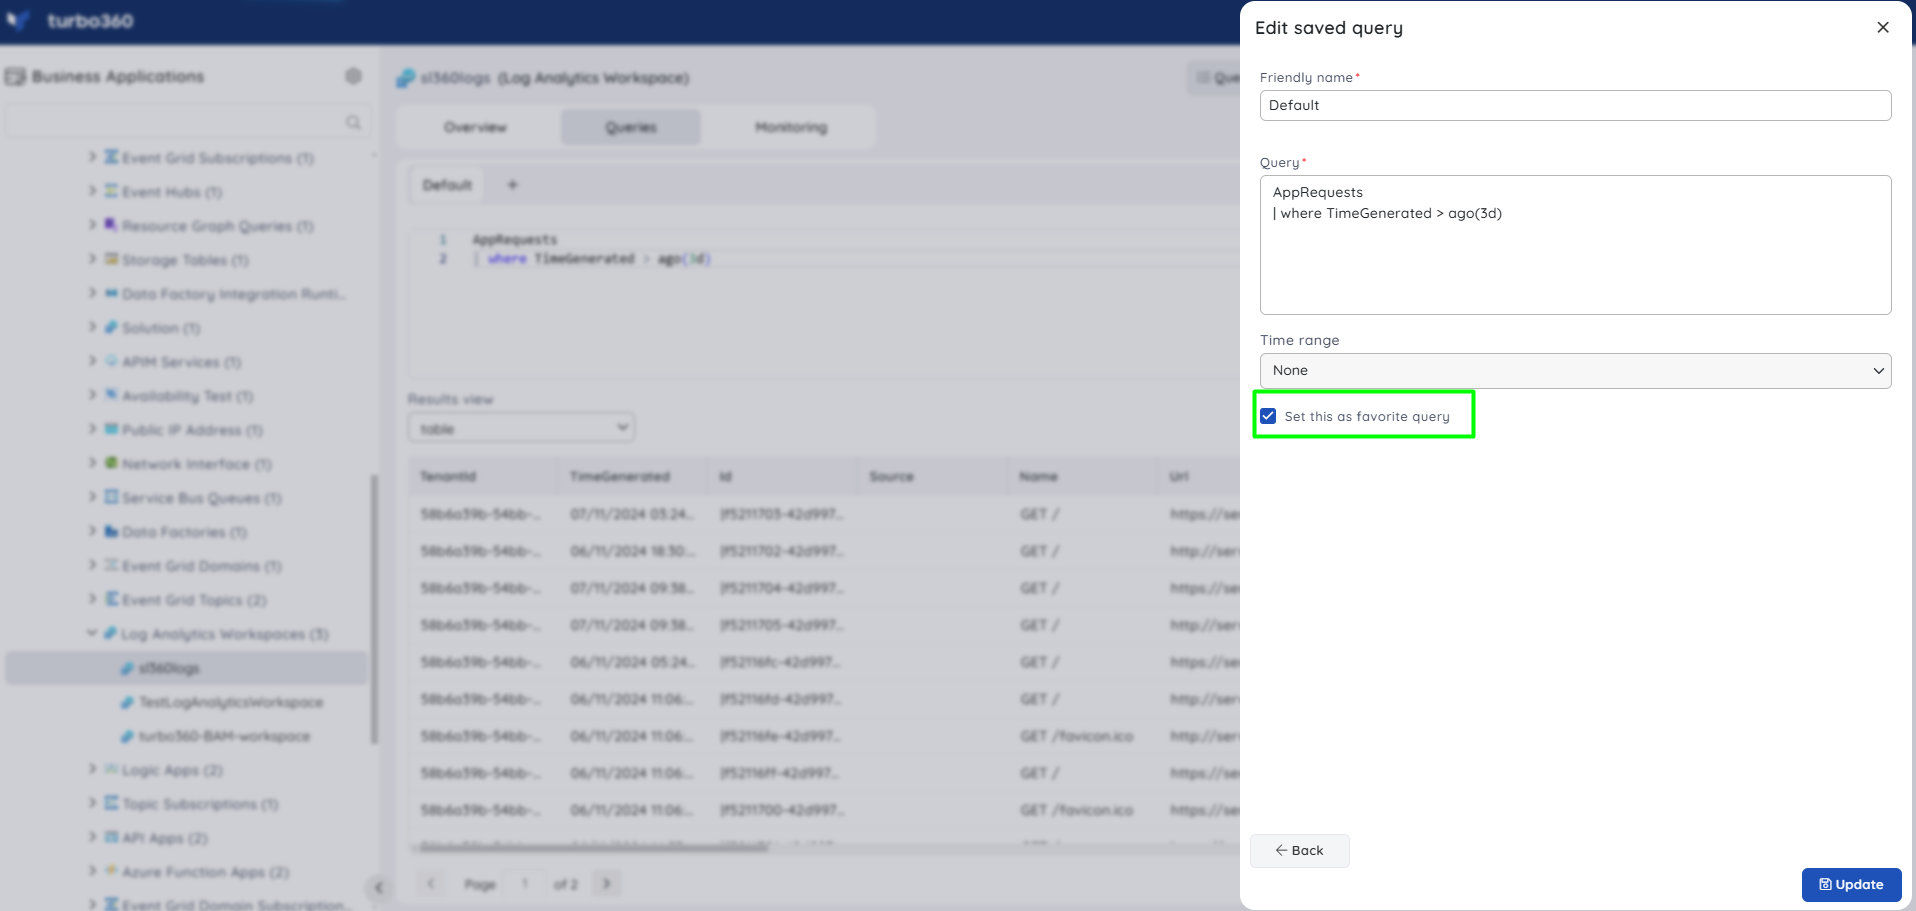
A Favorite query is automatically available in the Queries tab. Mark a query as a favorite by editing a saved query or saving a new one.
- Time range filter — apply a time range to a query to retrieve only the data within that window. Use this when investigating an issue within a specific time period rather than across all available data.
Query widgets
- Add a query widget — add a query-based widget to a Business Application or Resource dashboard by setting the Data source to Query in widget configuration, entering a valid query, and clicking Run. Use this when you need a custom visualization that the default dashboard widgets don't cover. Select the appropriate data label from the Y-axis dropdown and the X-axis checkboxes to customize the values that appear on each axis.
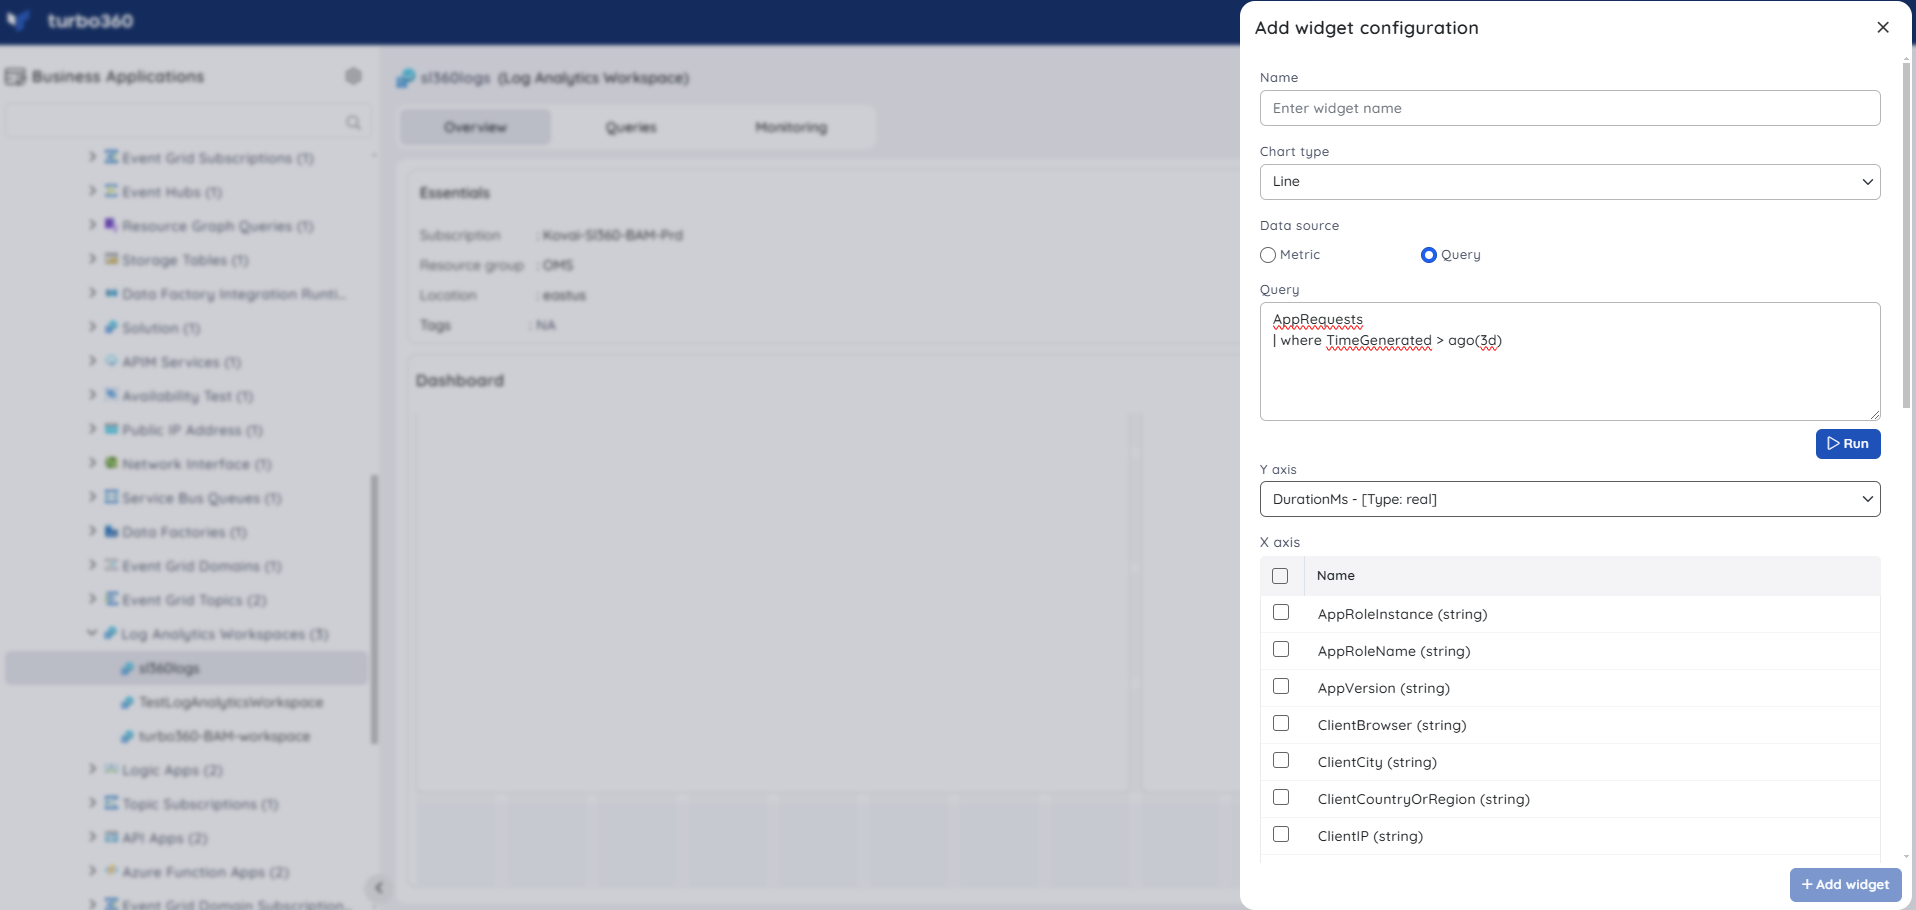
Query widgets do not display time settings information in their tooltip because the data is generated only for the desired query, regardless of time settings configuration.
Count charts do not support Query data sources.
Resource dashboard
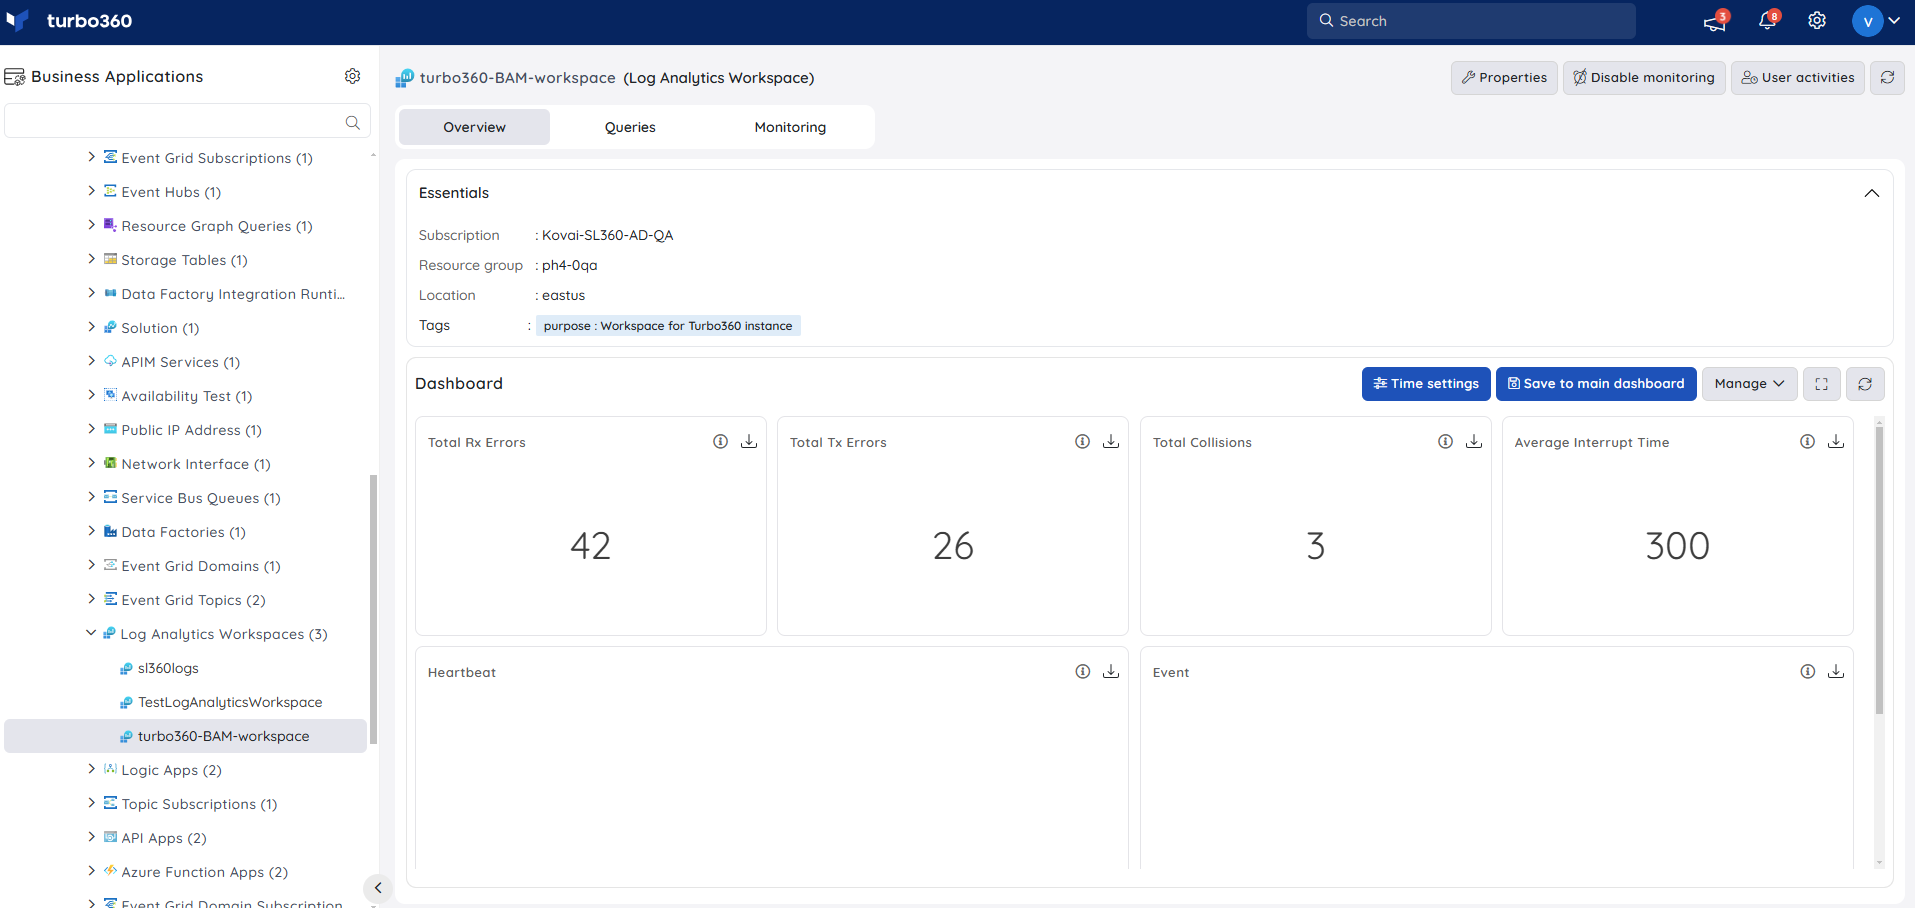
The Log Analytics Workspace dashboard surfaces network and event signals so you can spot connectivity or data collection issues without leaving Turbo360.
| Widget | What it shows |
|---|---|
| Total Rx Errors | Count of received network errors. |
| Total Tx Errors | Count of transmitted network errors. |
| Total Collisions | Count of network packet collisions. |
| Average Interrupt Time | Average system interrupt time, useful for spotting resource contention. |
| Heartbeat | Agent heartbeat signal confirming the data source is reporting. |
| Event | Count of logged events. |
Metrics
The Metrics tab surfaces network health and event count data for Log Analytics Workspace, giving you visibility into agent connectivity and log collection activity. Use the Metrics tab to confirm that the agent heartbeat is stable and to identify periods of elevated network errors that may affect log collection reliability.
You can add, remove, or reconfigure widgets, including query widgets, to focus on the metrics most relevant to your support scenario.
Monitoring
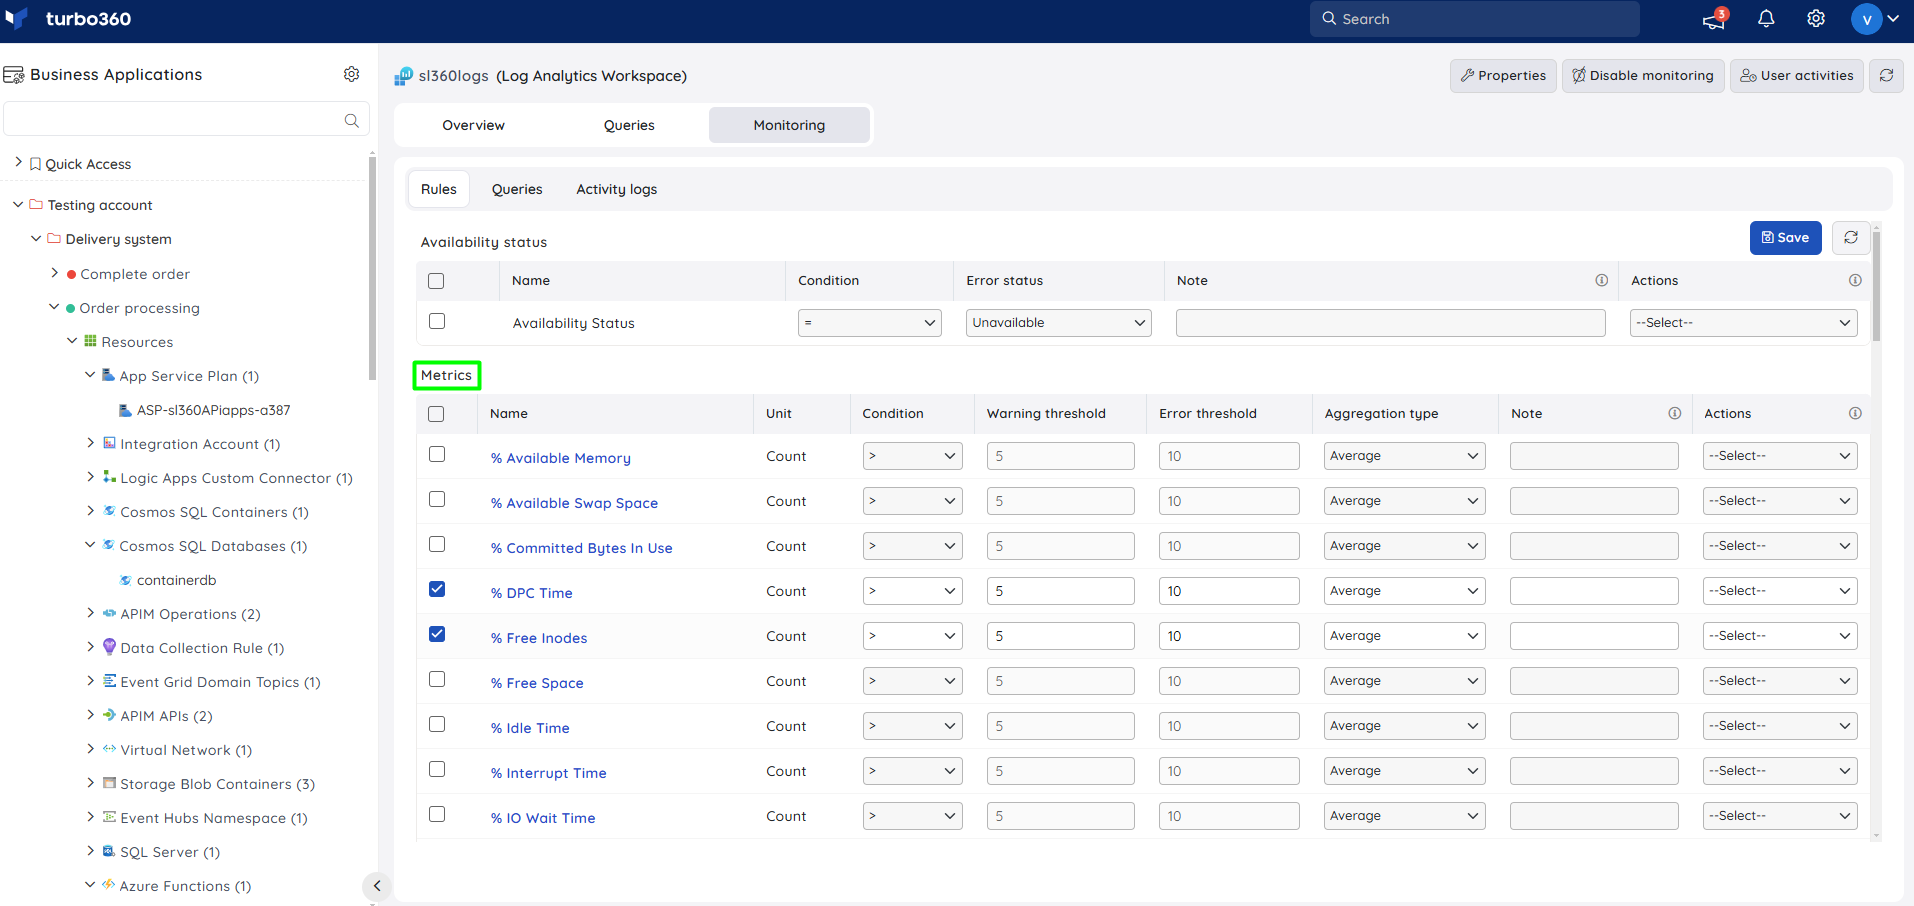
Log Analytics Workspace supports availability status, metric, and query monitoring rules, configured under Log Analytics Workspace -> Monitoring.
Monitoring rules are saved per resource, and the monitoring state is reflected after every monitoring cycle.
Availability status monitoring
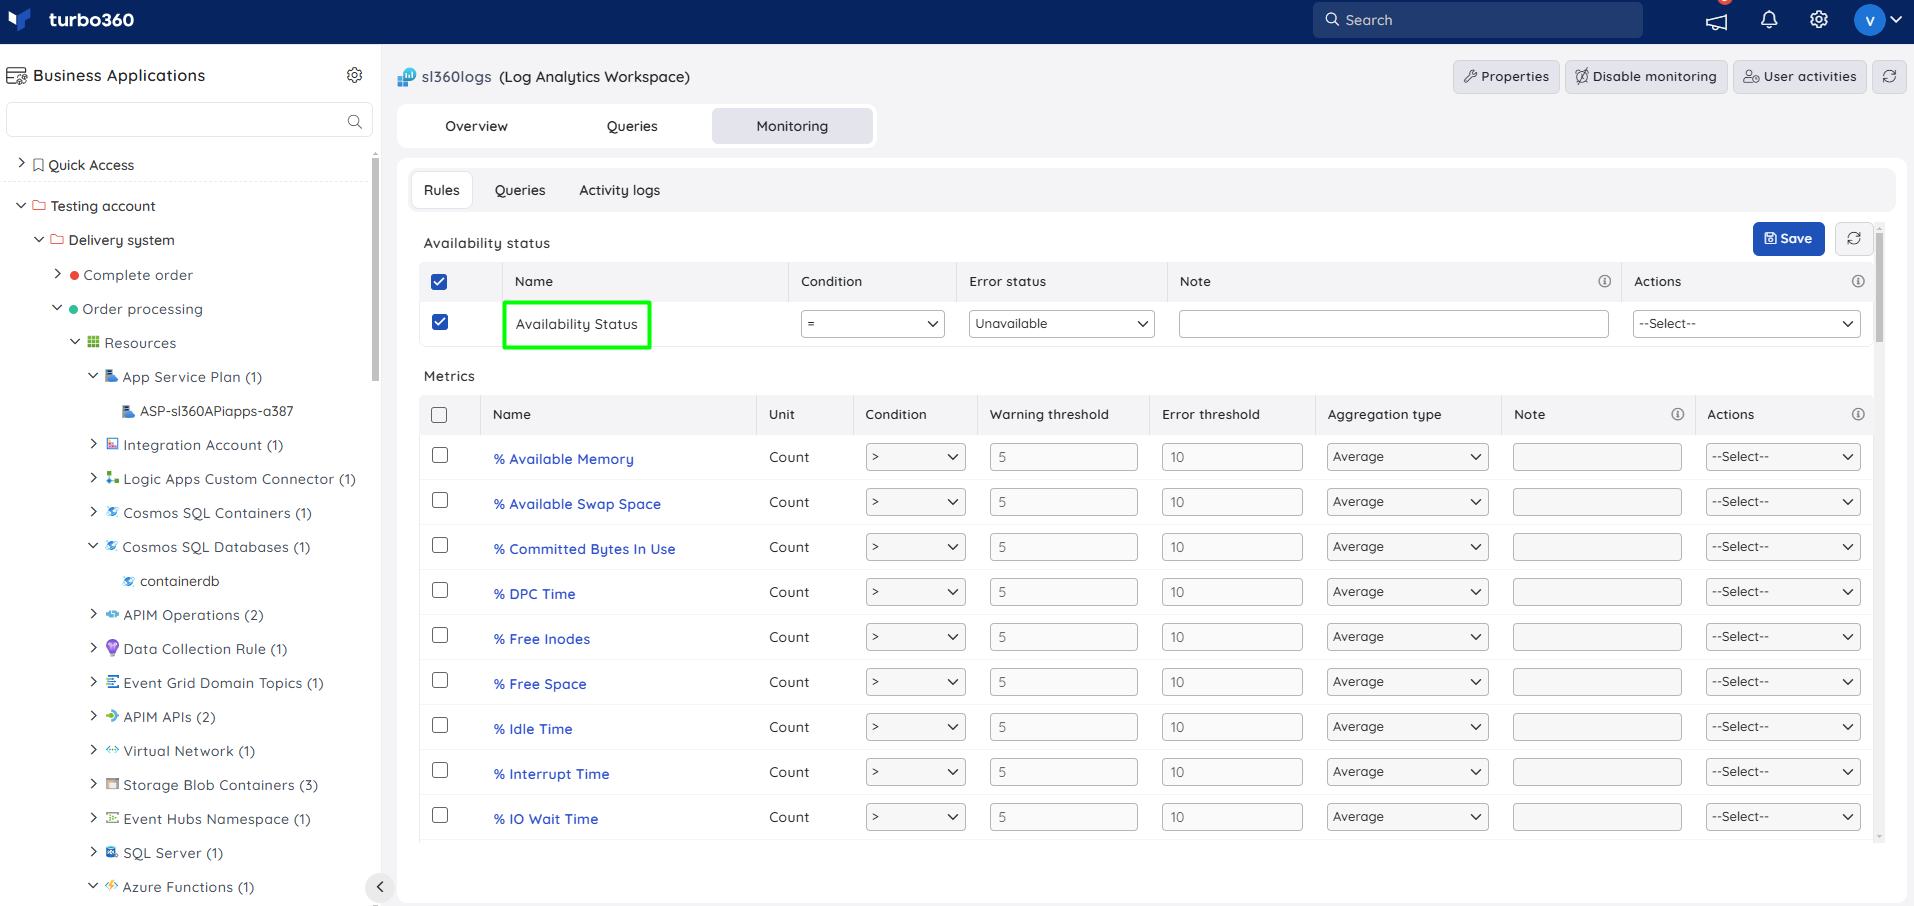
Tracks the resource health status of the workspace. Use this when you need to be alerted as soon as the workspace becomes unavailable or degraded.
- Navigate to Log Analytics Workspace -> Monitoring.
- Configure the Availability status rule with the desired threshold.
- Click Save.
Metric monitoring
Tracks resource metrics against a configured threshold. Use this when you need to be alerted if a metric exceeds expected bounds.
- Switch to the Metrics and properties tab to configure rules for metric monitoring.
- Select the necessary monitoring metrics and configure the threshold values.
- Click Save.
Query monitoring
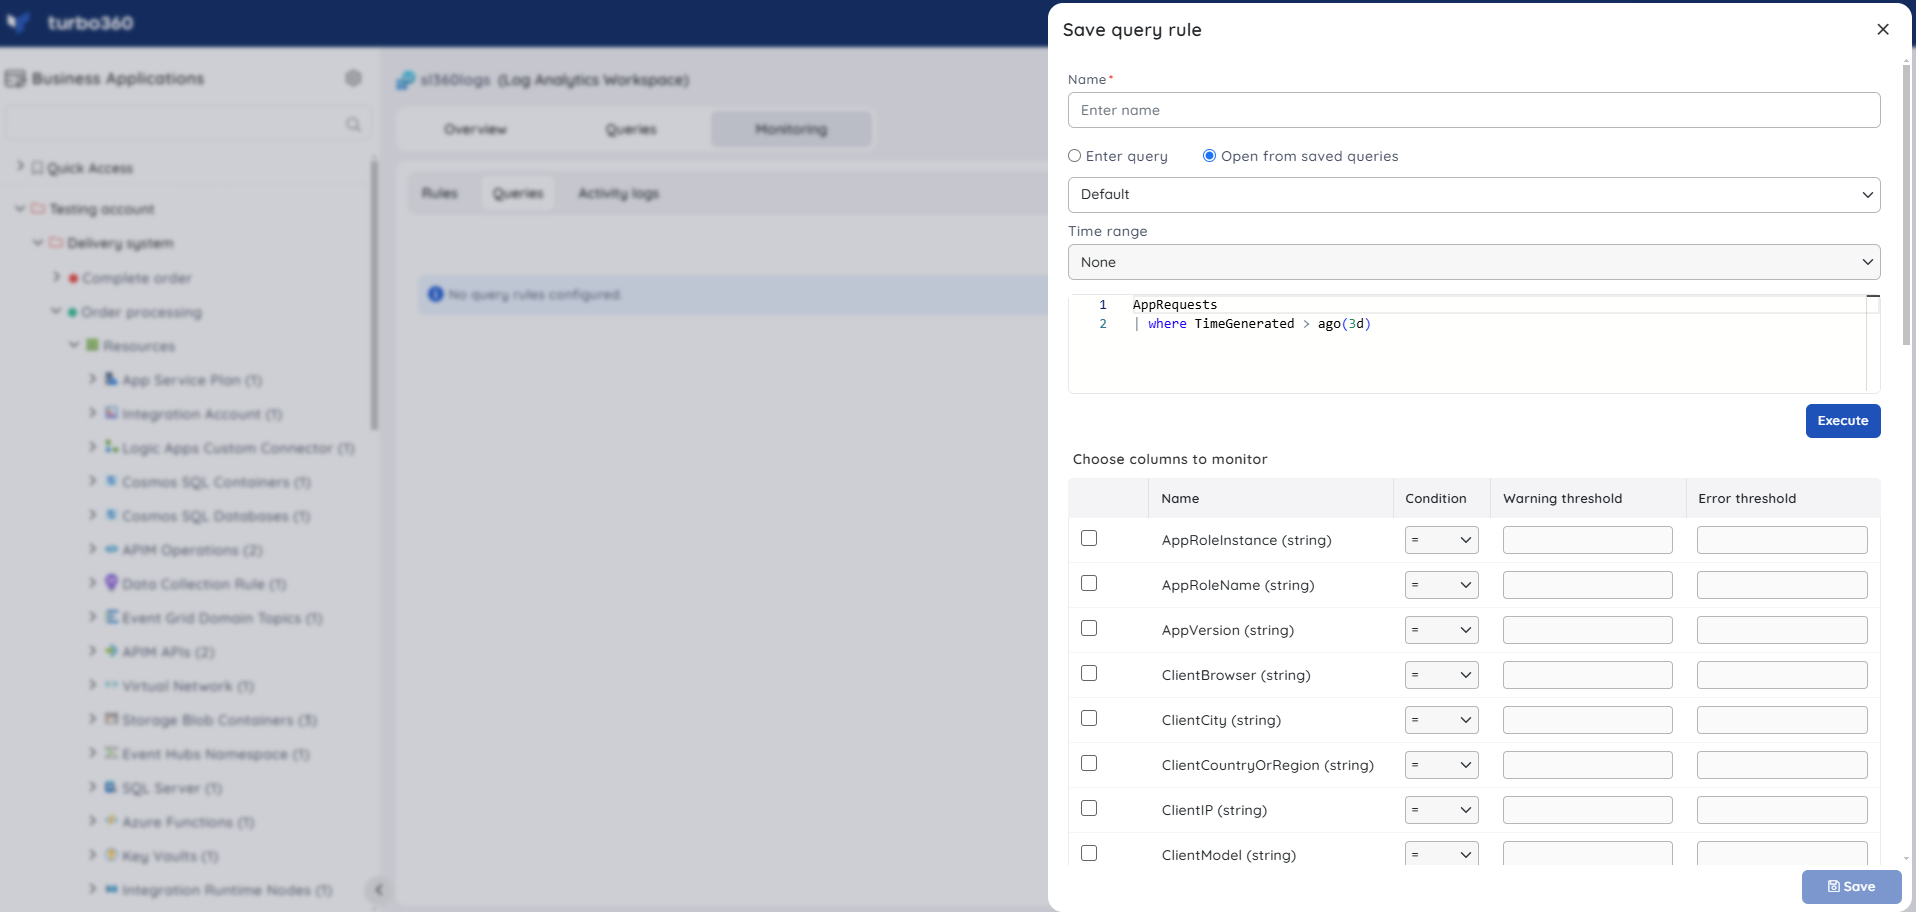
Tracks the result of a saved or custom query against a threshold. Use this when a specific query result needs to trigger an alert. Log Analytics allows both scalar and non-scalar queries for query monitoring.
- Switch to the Queries tab to configure rules for query monitoring.
- Click Add.
- Enter a name for the query rule.
- Enter the desired query by choosing Enter query, or select one from saved queries using Open from saved queries.
- Select the preferred time range.
- Click Execute to run the query.
- Select the required query columns and configure the threshold values.
- Click Save.
The metric thresholds can also include any metric name as their value.
Troubleshooting
- Query monitoring rule does not trigger
Cause: The query was not executed and validated before saving.
Fix: Reopen the rule, click Execute, confirm the result, and save again. - Query widget shows no data
Cause: The Data source was not set to Query, or the query returned no results for the selected time range.
Fix: Confirm the widget's Data source is set to Query and that the query returns results when run directly. - Count chart shows an error with a query data source
Cause: Count charts do not support Query data sources.
Fix: Use a different chart type, such as table or column, for query-based widgets. - Dashboard widgets show no data
Cause: The workspace was recently associated and has not completed its first monitoring cycle.
Fix: Wait for the next monitoring cycle, then refresh the dashboard.
Related articles
Was this article helpful?