

Logic App
- 05 Aug 2026
- 9 Minutes to read
- Print
- DarkLight
- Download PDF
Logic App
- Updated on 05 Aug 2026
- 9 Minutes to read
- Print
- DarkLight
- Download PDF
Article summary
Did you find this summary helpful?
Thank you for your feedback!
Overview
Logic App is a cloud service that helps you schedule, automate, and orchestrate tasks, business processes, and workflows when you need to integrate apps, data, systems, and services across enterprises or organizations.
Business value
Managing Logic App runs and triggers from Turbo360 gives you a single place to investigate failures, recover from errors, and automate recovery, reducing the time to detect and resolve workflow execution issues.
How it works
- Once a Logic App is associated with a Business Application, its status, run history, trigger history, and monitoring become directly manageable from Turbo360.
- A Logic App run can fail when an individual action encounters an error — an expected scenario in complex business orchestrations.
Permissions
Access to Logic App actions is controlled through RBAC when adding a role to a Business Application.
| Permission | Description |
|---|---|
| Read | View run history, trigger history, and monitoring rules. |
| Manage | Enable/disable, invoke triggers, configure inline and automated tasks, and configure monitoring rules. |
| Reprocess | Resubmit failed runs, individually or in bulk. |
Operations
Turbo360 lets you control Logic App status, invoke triggers, and recover from failed runs directly, without switching to the Azure portal.
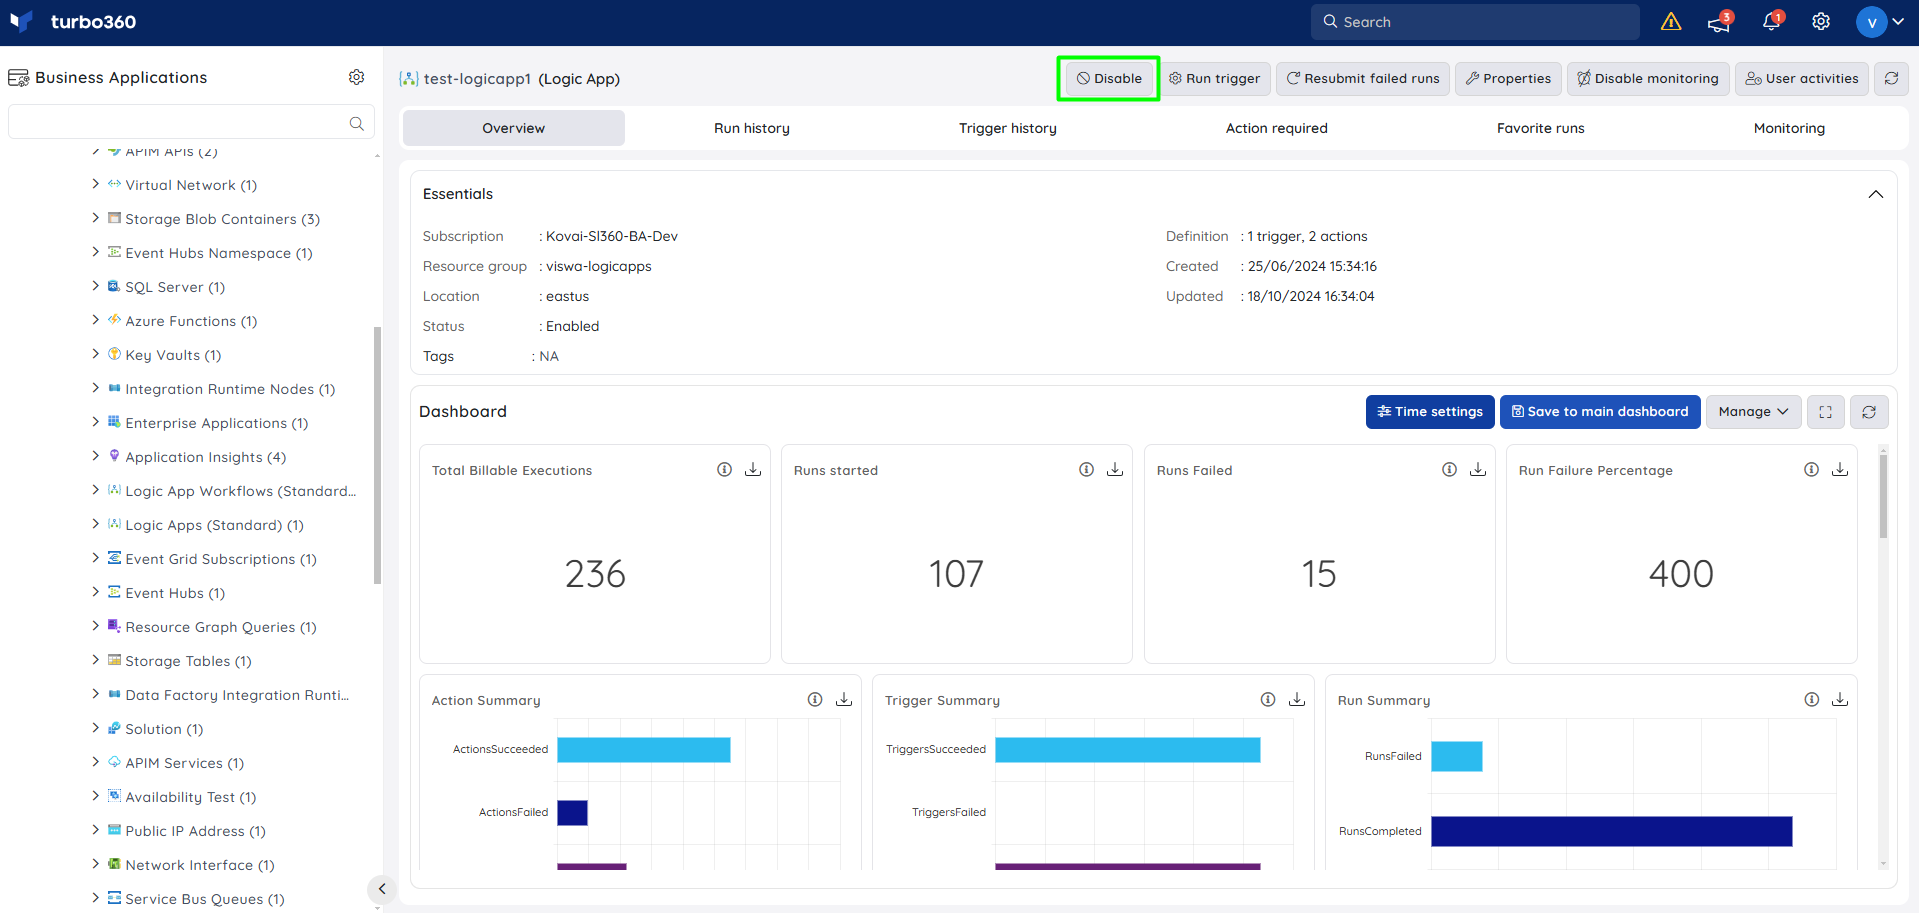
Enable and Disable
- Enable — turn on a Logic App, reflecting its status in the Azure Subscription.
- Disable — turn off a Logic App, reflecting its status in the Azure Subscription.
Bulk operations
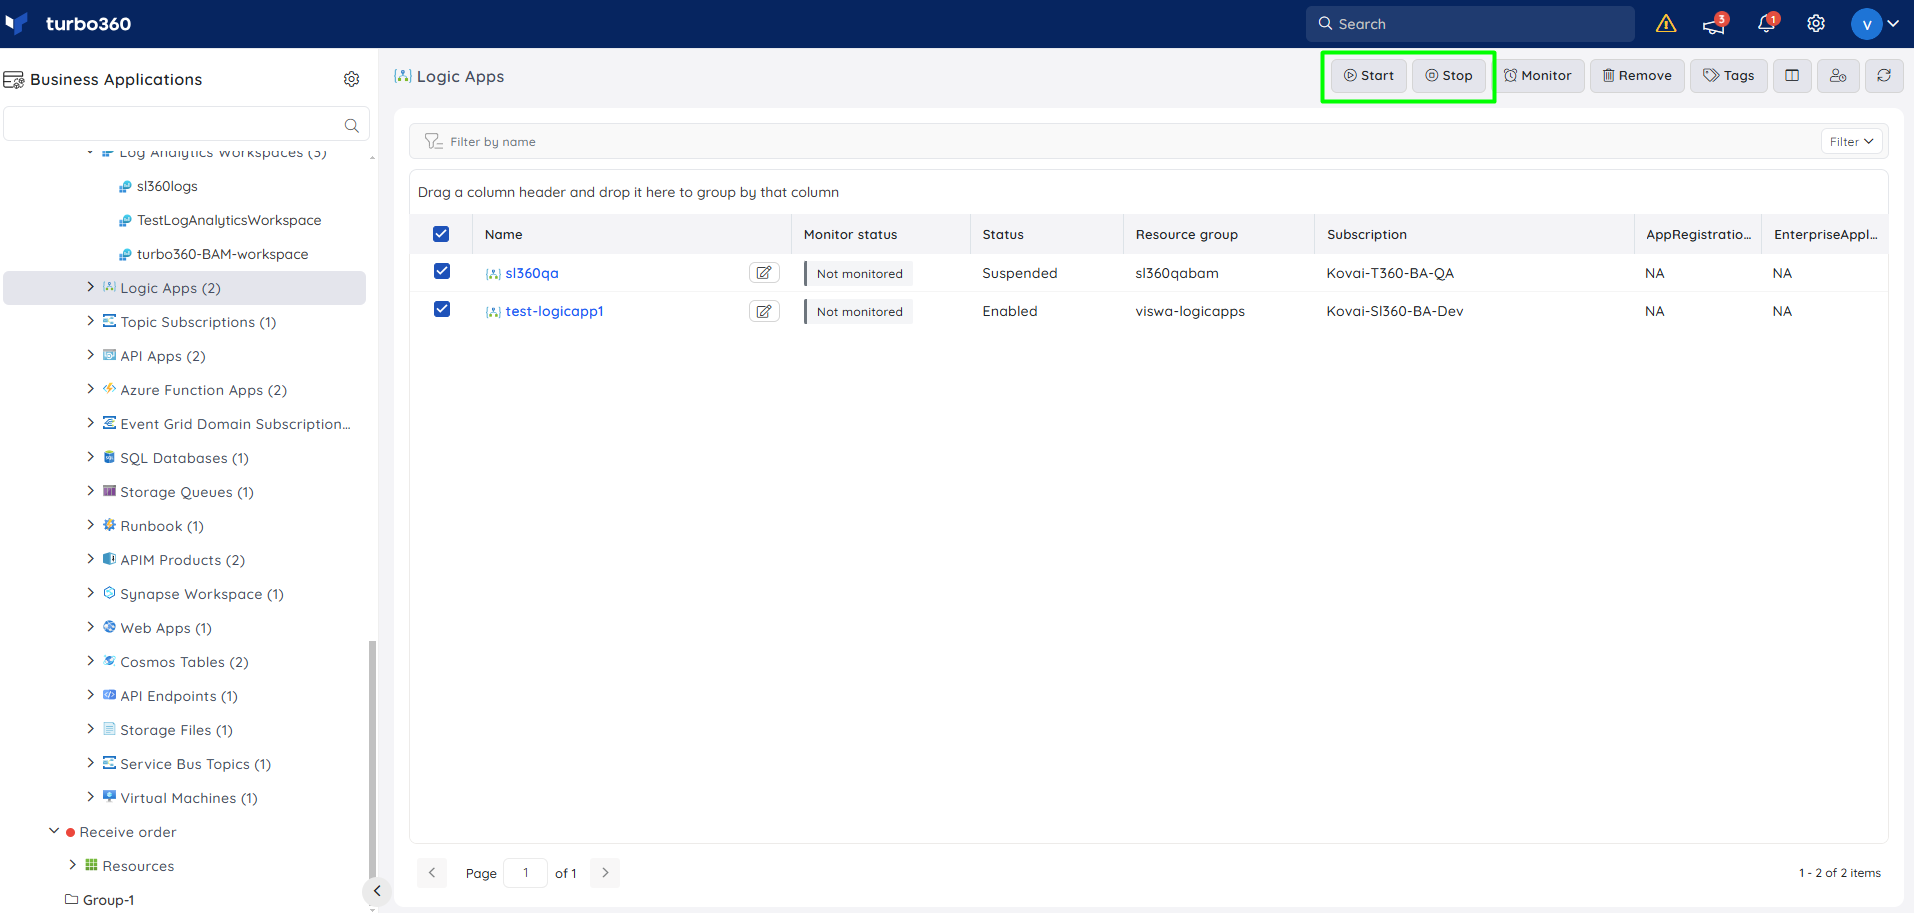
- Bulk Start/Stop — perform Enable or Disable on multiple Logic Apps at once from the Logic App resources section. Use this when several Logic Apps need the same status change together, such as during planned maintenance.
Run trigger
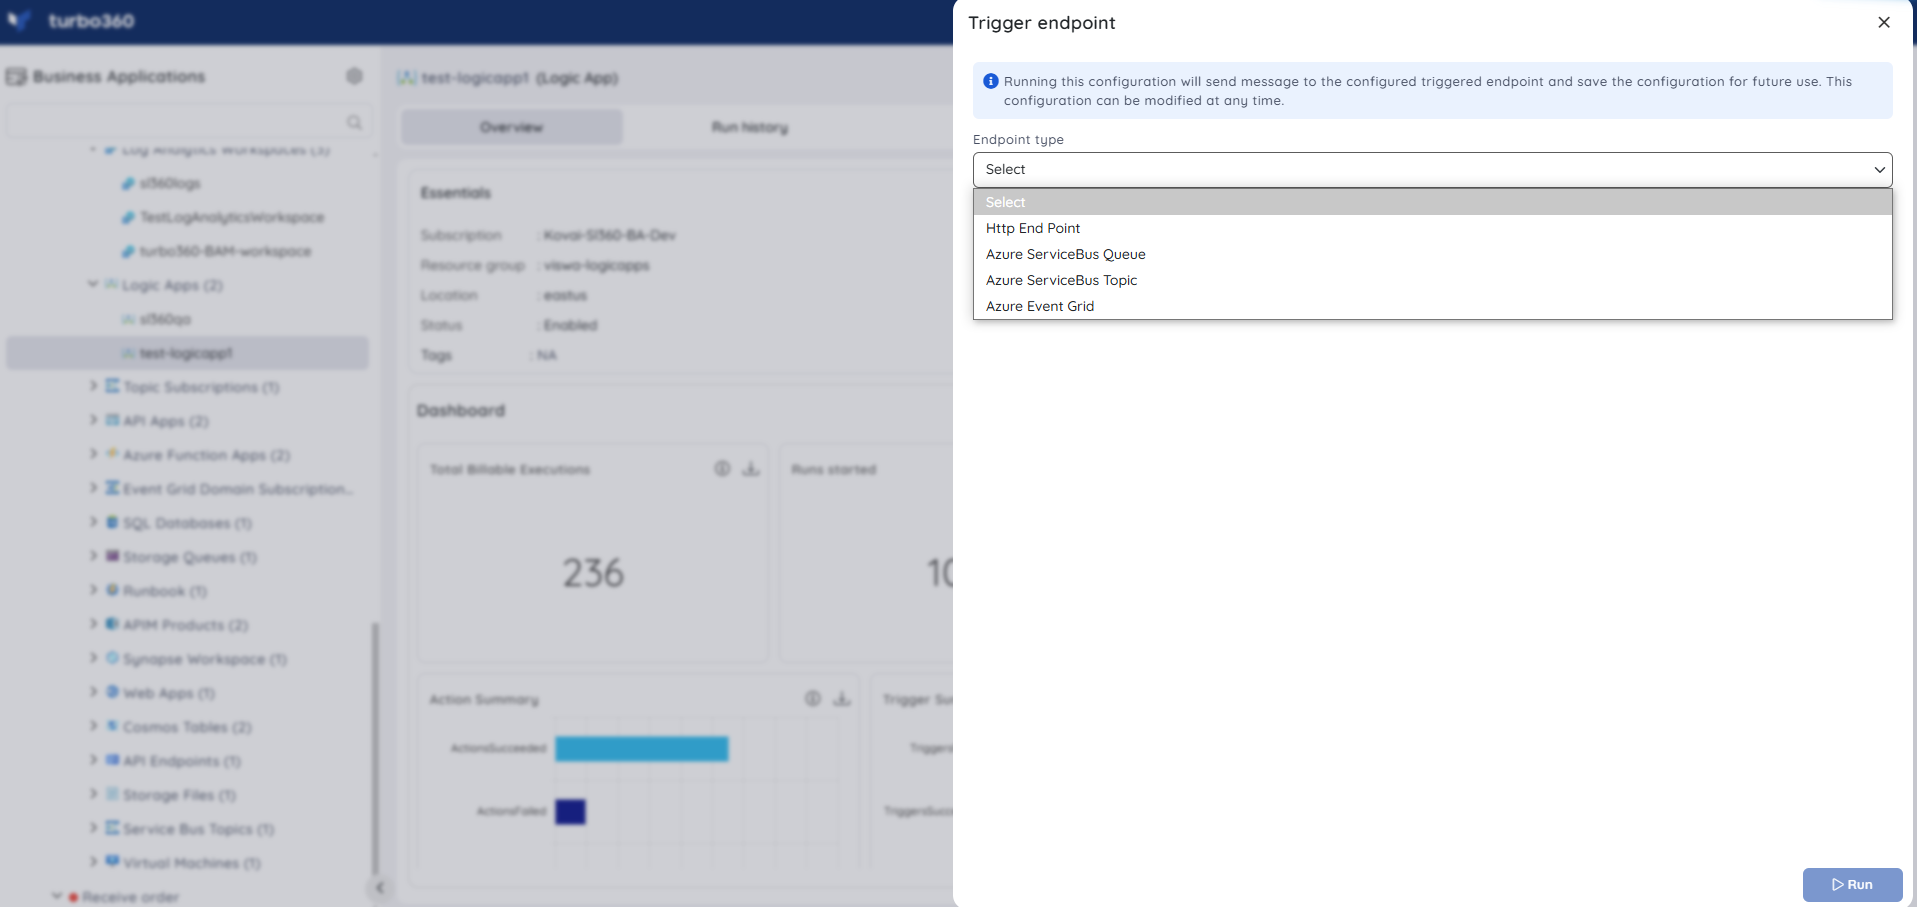
- Run trigger — invoke a Logic App by sending a message to its trigger, modifying the message if needed before sending. Use this when a Logic App needs to be recovered from an error condition by replaying a corrected message. The option appears at the top of the screen when you open a specific Logic App; provide the trigger details and send the message to perform the operation.
Run history
- View run history — Run history displays a list of Logic App executions, including start time, duration, and associated tags. Use this when you need to review execution outcomes over time.
.png)
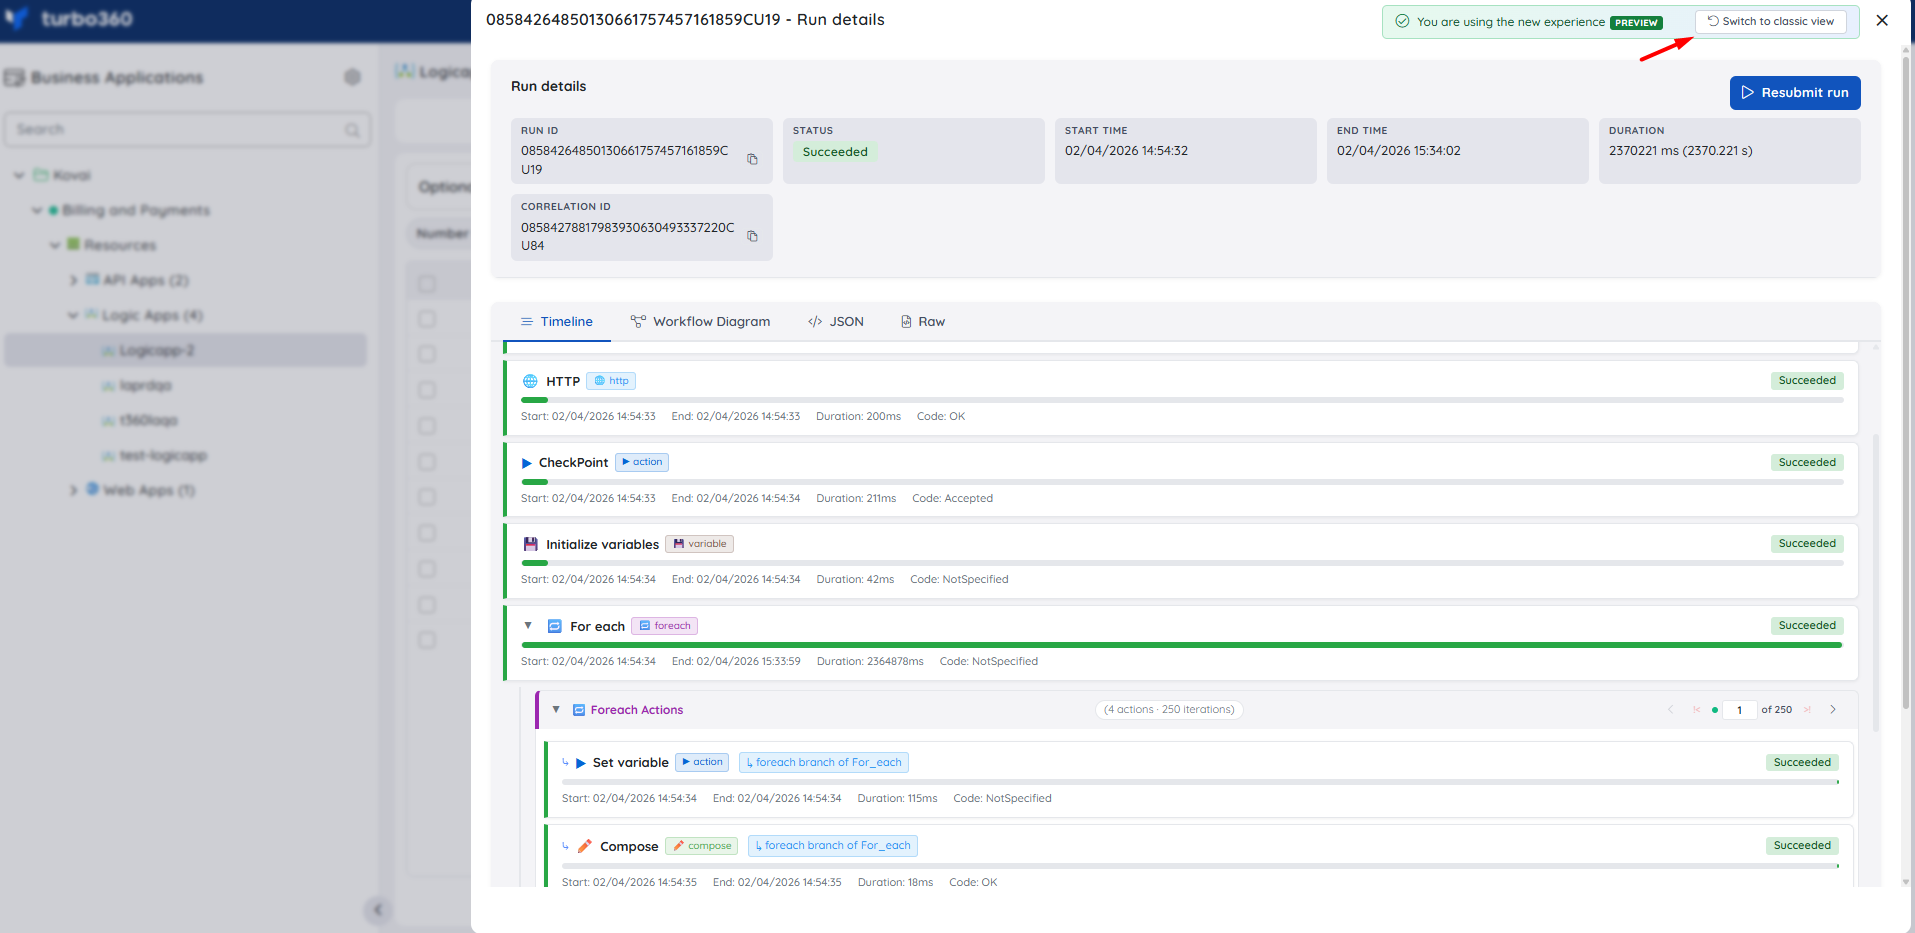
- Drill into a run — click a run identifier to open detailed information, including each trigger and action's inputs and outputs. Use this when diagnosing why a specific execution failed or behaved unexpectedly.
.png)
The enhanced Run history view organizes execution steps into a timeline, letting you trace the path of a run, inspect individual actions, and access detailed inputs and outputs — and resubmit runs directly from the same view.
Optional settings available in the Run history tab:
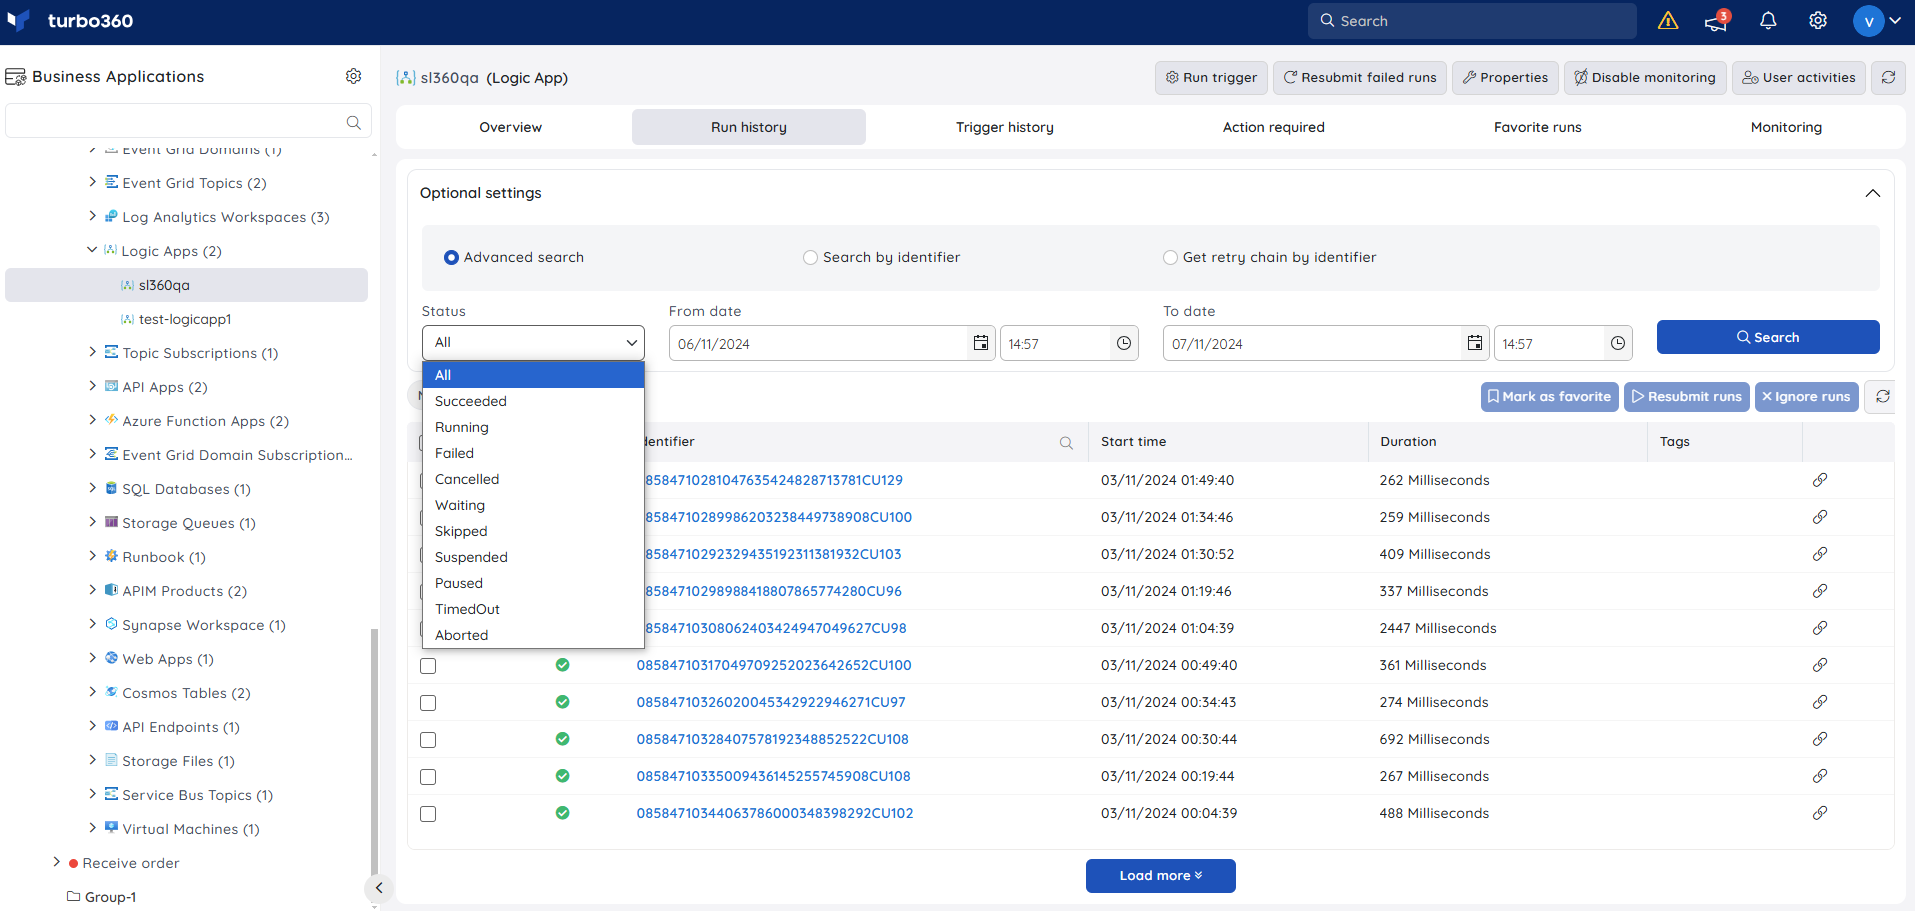
- Advanced search — filter runs by From date and To date along with a status (Succeeded, Running, Failed, Cancelled, Waiting, Skipped, Suspended, Paused, Timed Out, or Aborted). Use this when narrowing down a large run history to a specific window and outcome.
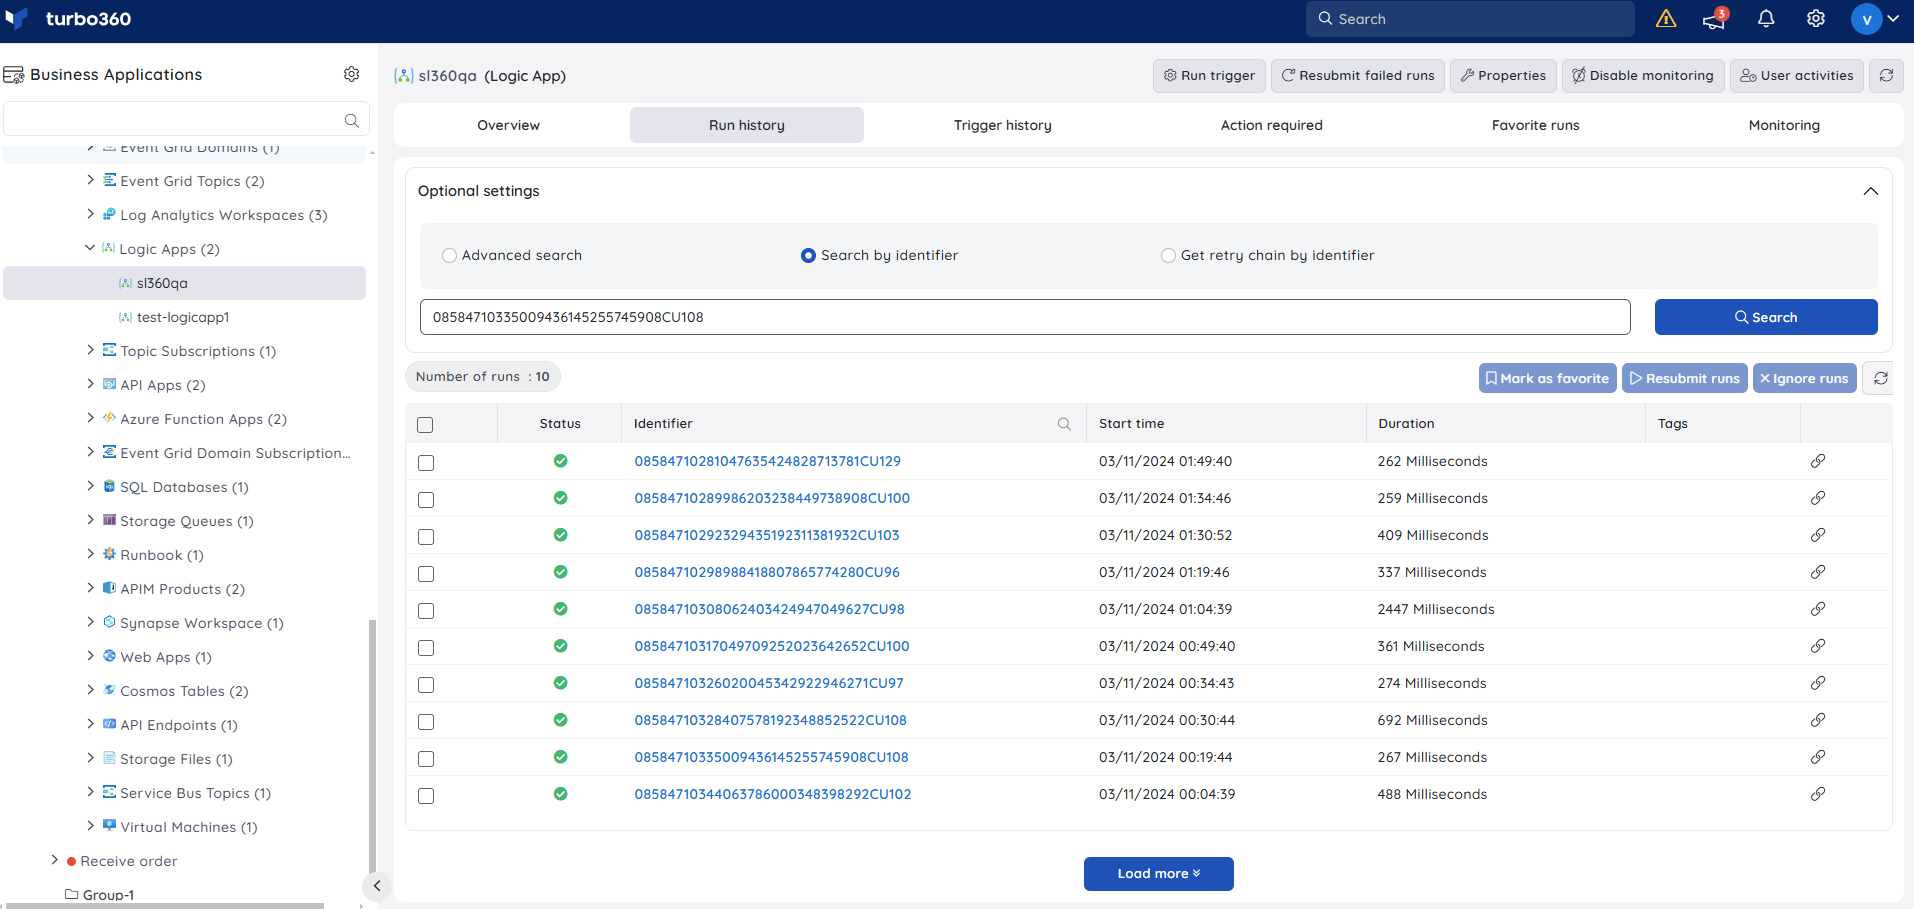
- Search by identifier — retrieve run details for a specific identifier. Use this when you already have the run ID, such as from an external alert.
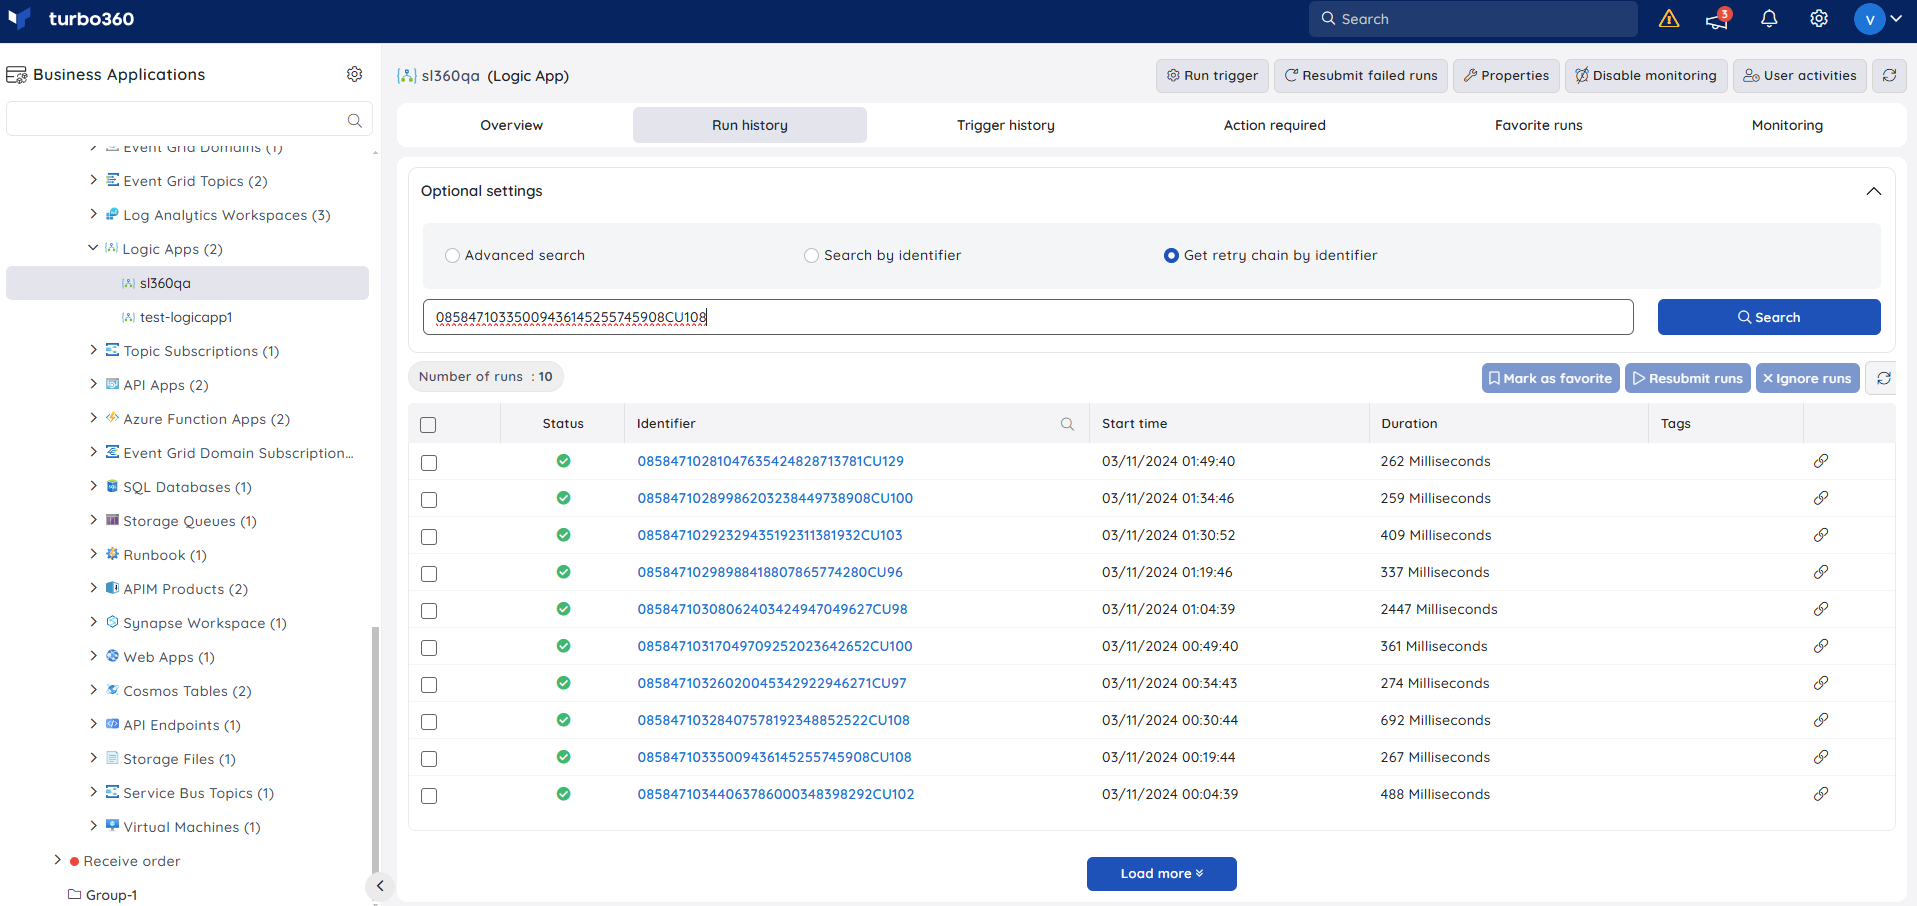
- Get Retry Chain by identifier — retrieve the retry chain for a run by entering its identifier, or by clicking the tag next to the run identifier. Use this when you need to trace all resubmissions related to an original run.
Resubmit failed runs
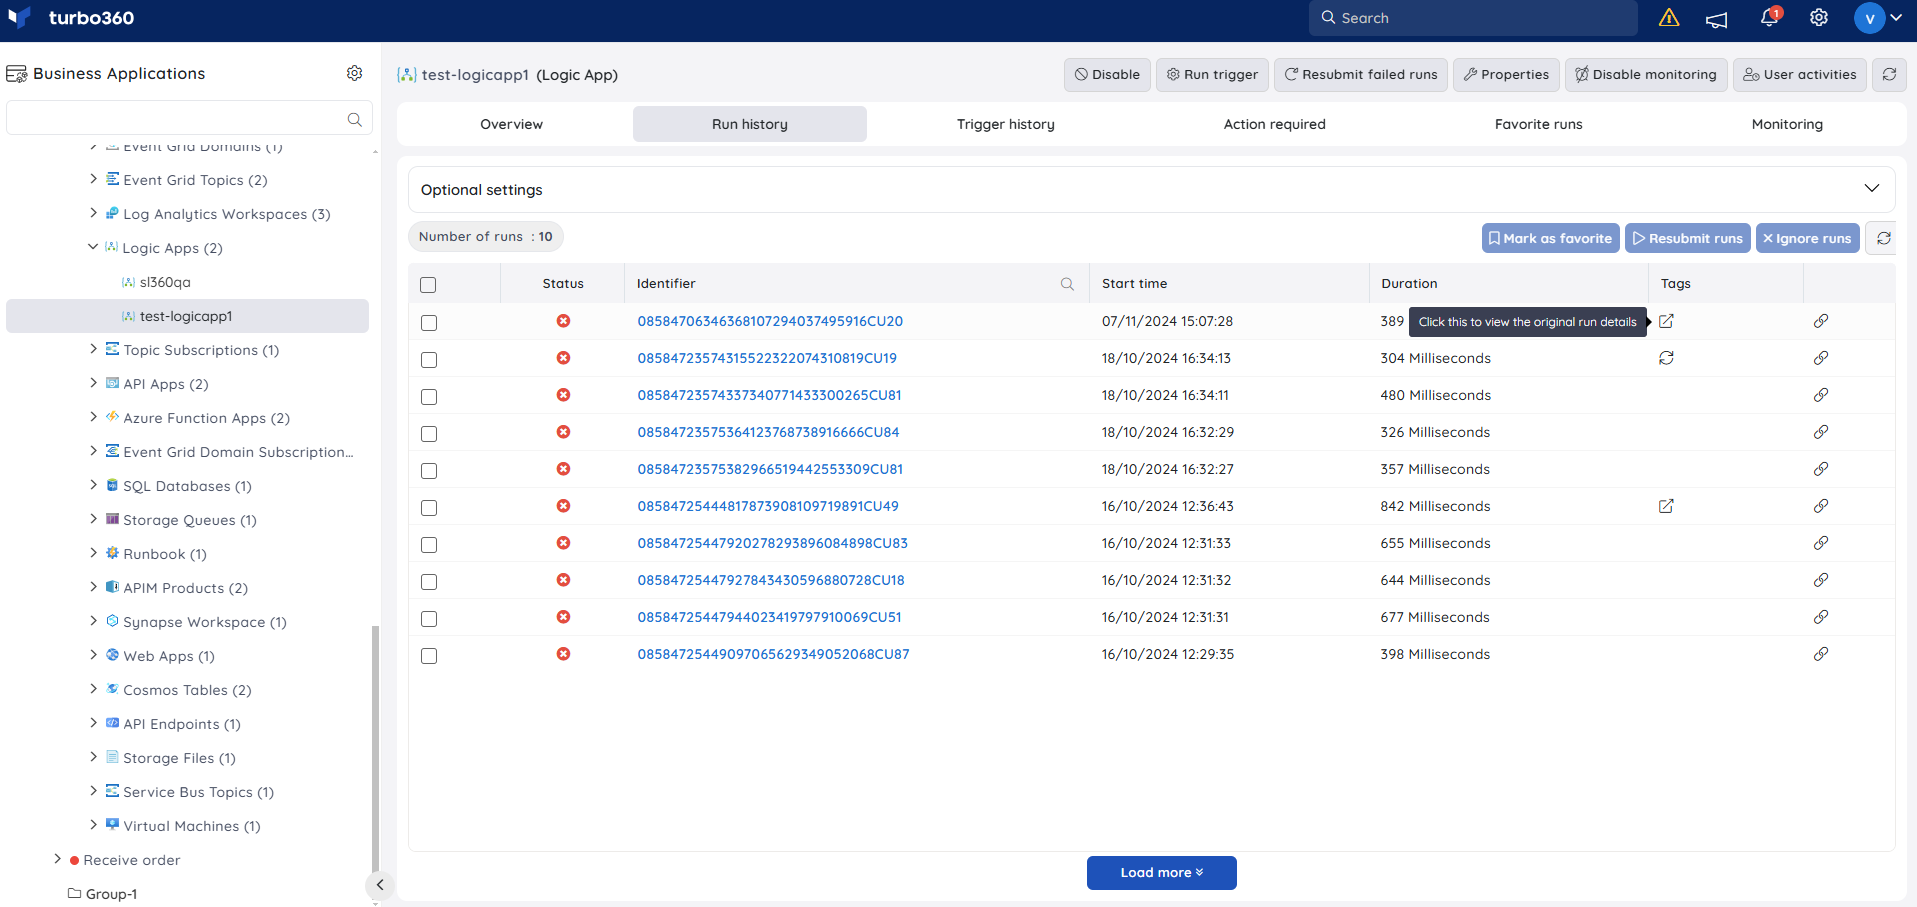
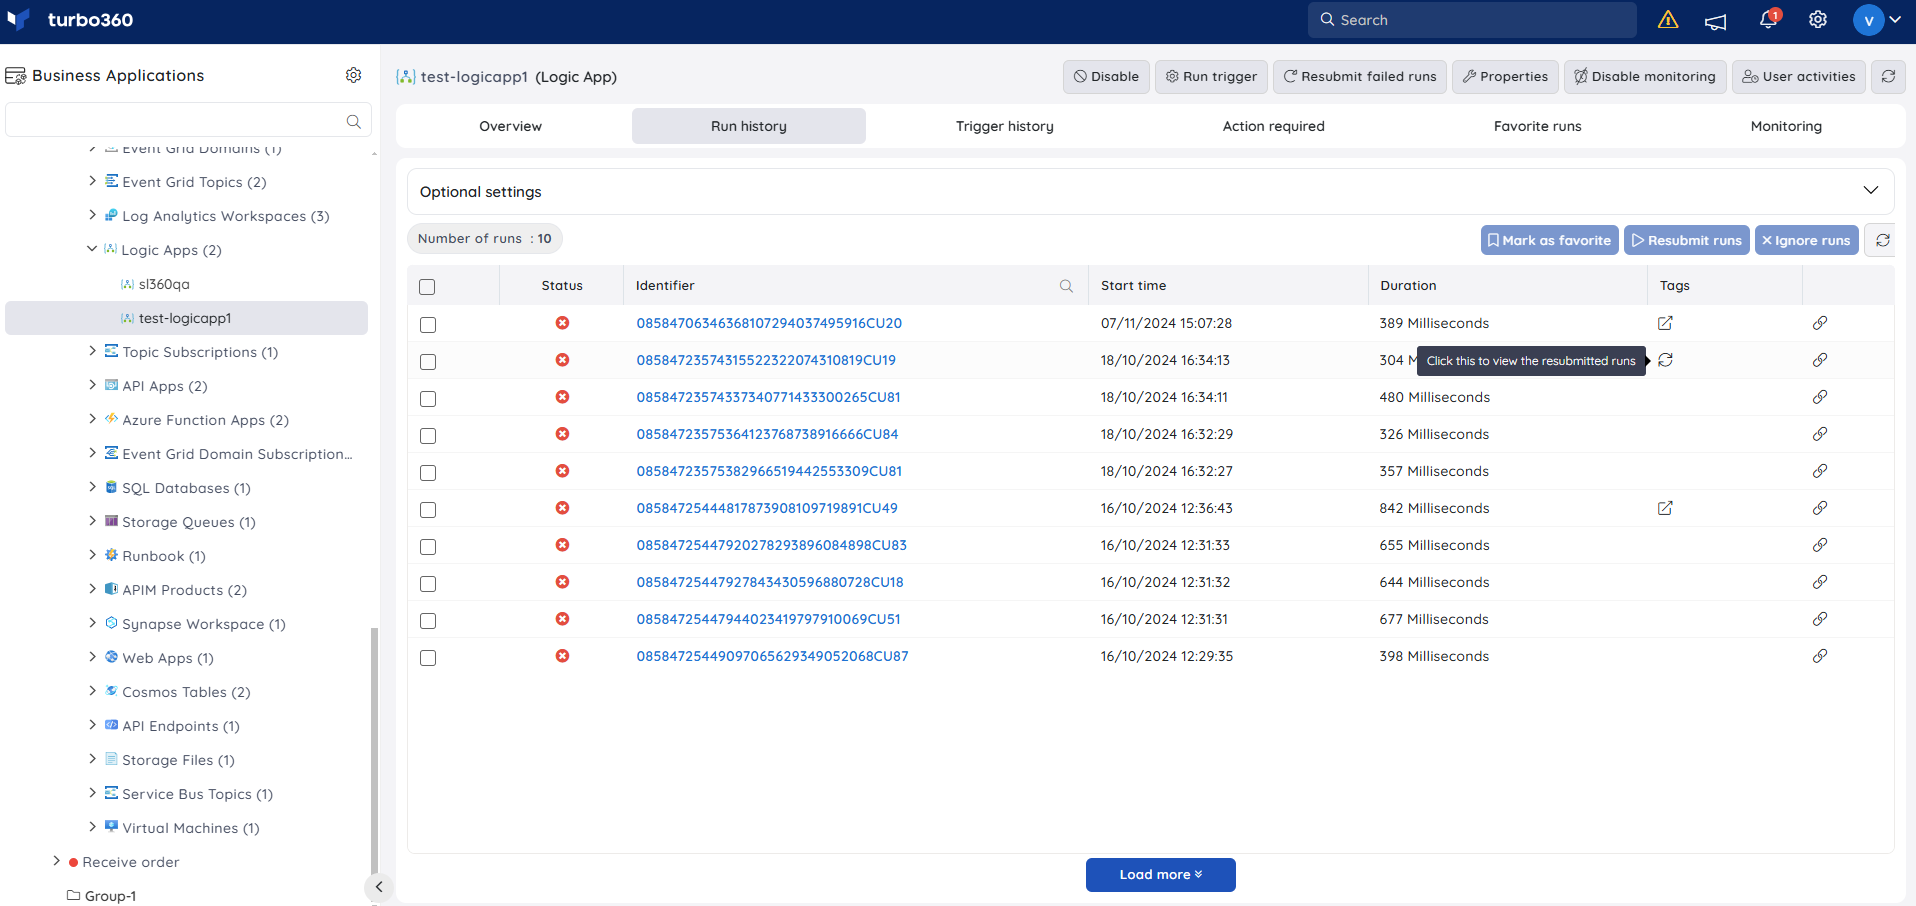
- Resubmit — resubmit a failed run directly from Run history. Use this when an action failed and the run needs to be replayed for recovery and continuity.
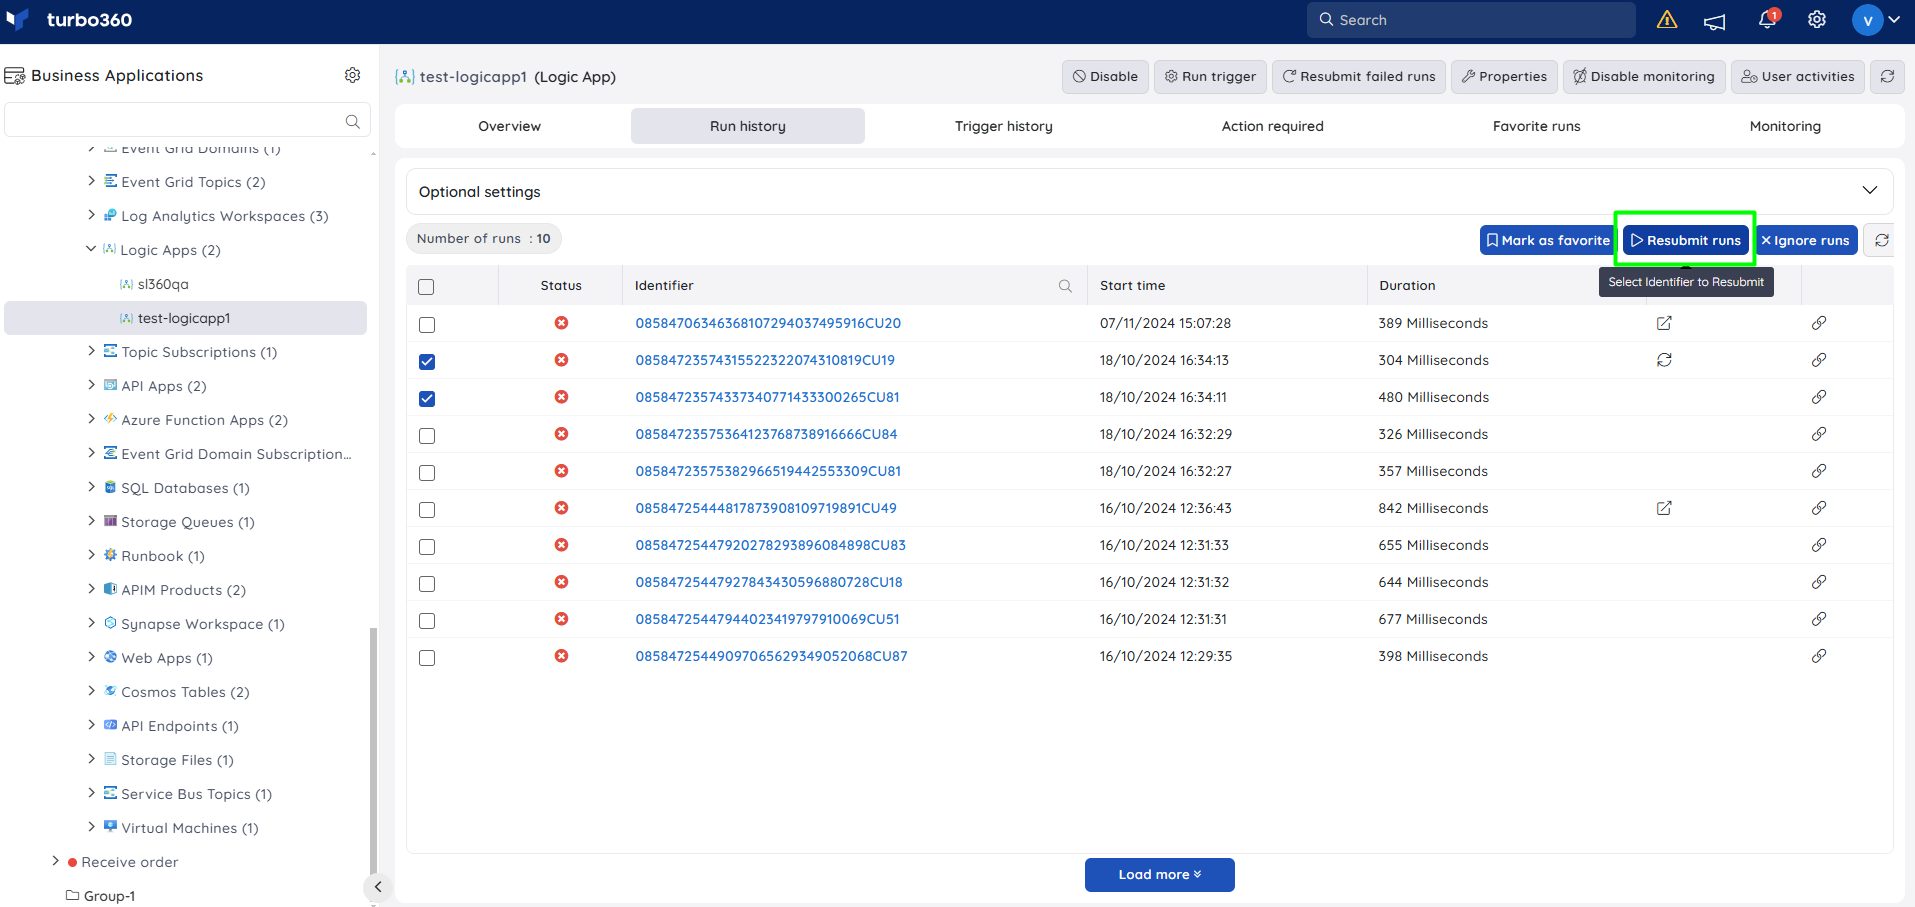
Resubmitted runs are tagged with a reference to the original parent run, providing clear traceability whether the resubmission happened from Turbo360 or the Azure portal.
Ignore runs
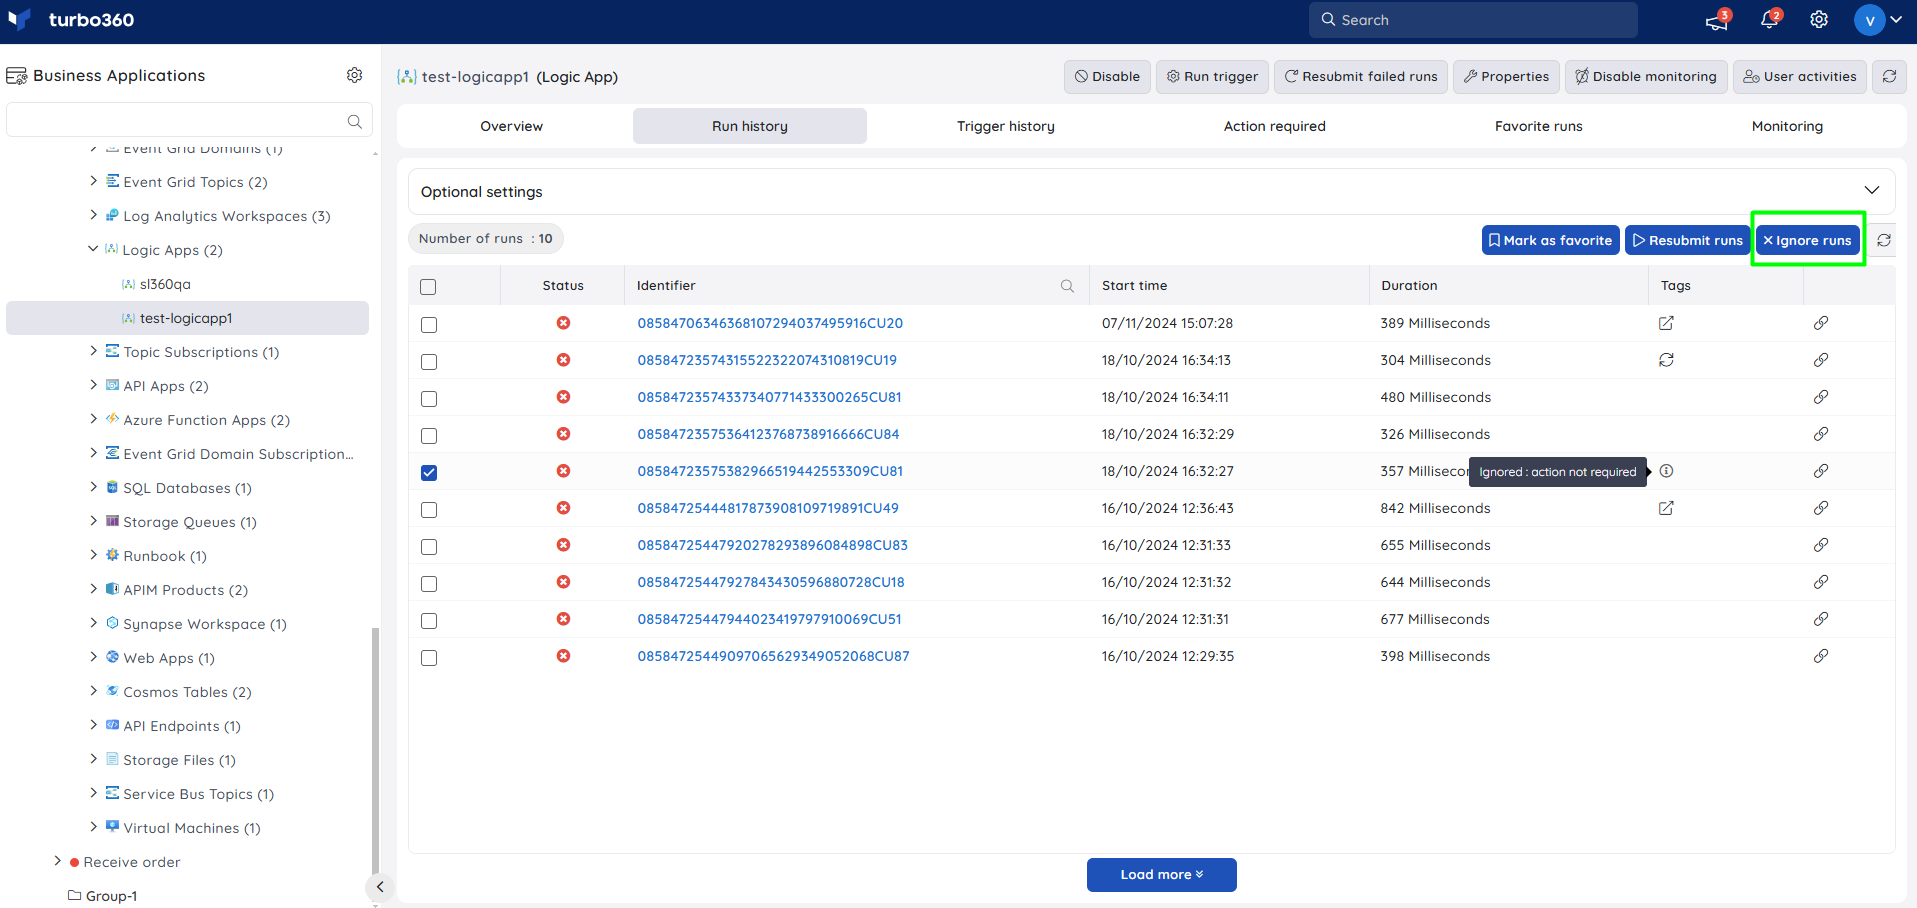
- Ignore runs — mark a bulk selection of runs as ignored, with a description attached. Use this when certain failed runs are not actionable and should be excluded from active triage. This tag is visible only in Turbo360 and has no effect on the actual runs.
Trigger history
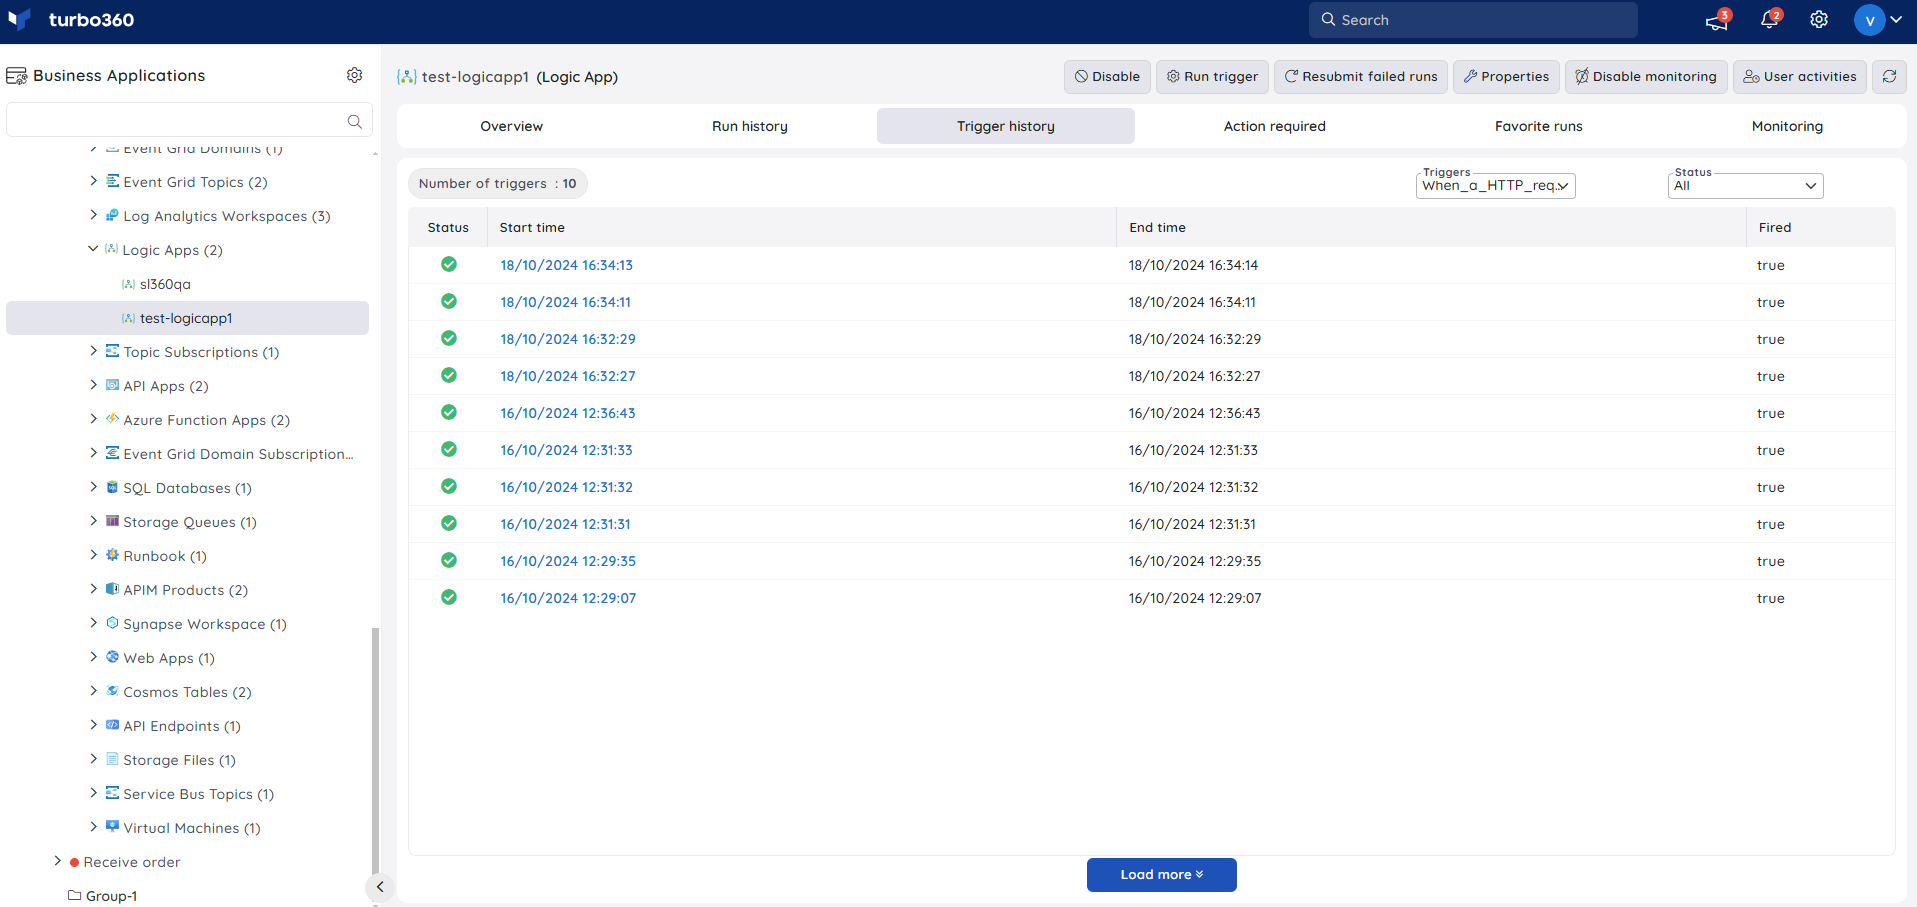
- View trigger history — view all triggers to the Logic App along with input and output details for each. Use this when investigating whether a trigger fired correctly, independent of the run it produced. When multiple triggers exist, history can be filtered by trigger, as in the Azure portal, and filtered by status (Succeeded, Running, Failed, Cancelled, Waiting, Skipped, Suspended, Paused, Timed out, Aborted).
Action required
- Action required — surfaces failed Logic App runs that need attention, and lets you resubmit or ignore them from the same view. Use this when you want to triage only the runs that need action rather than scanning the full run history.
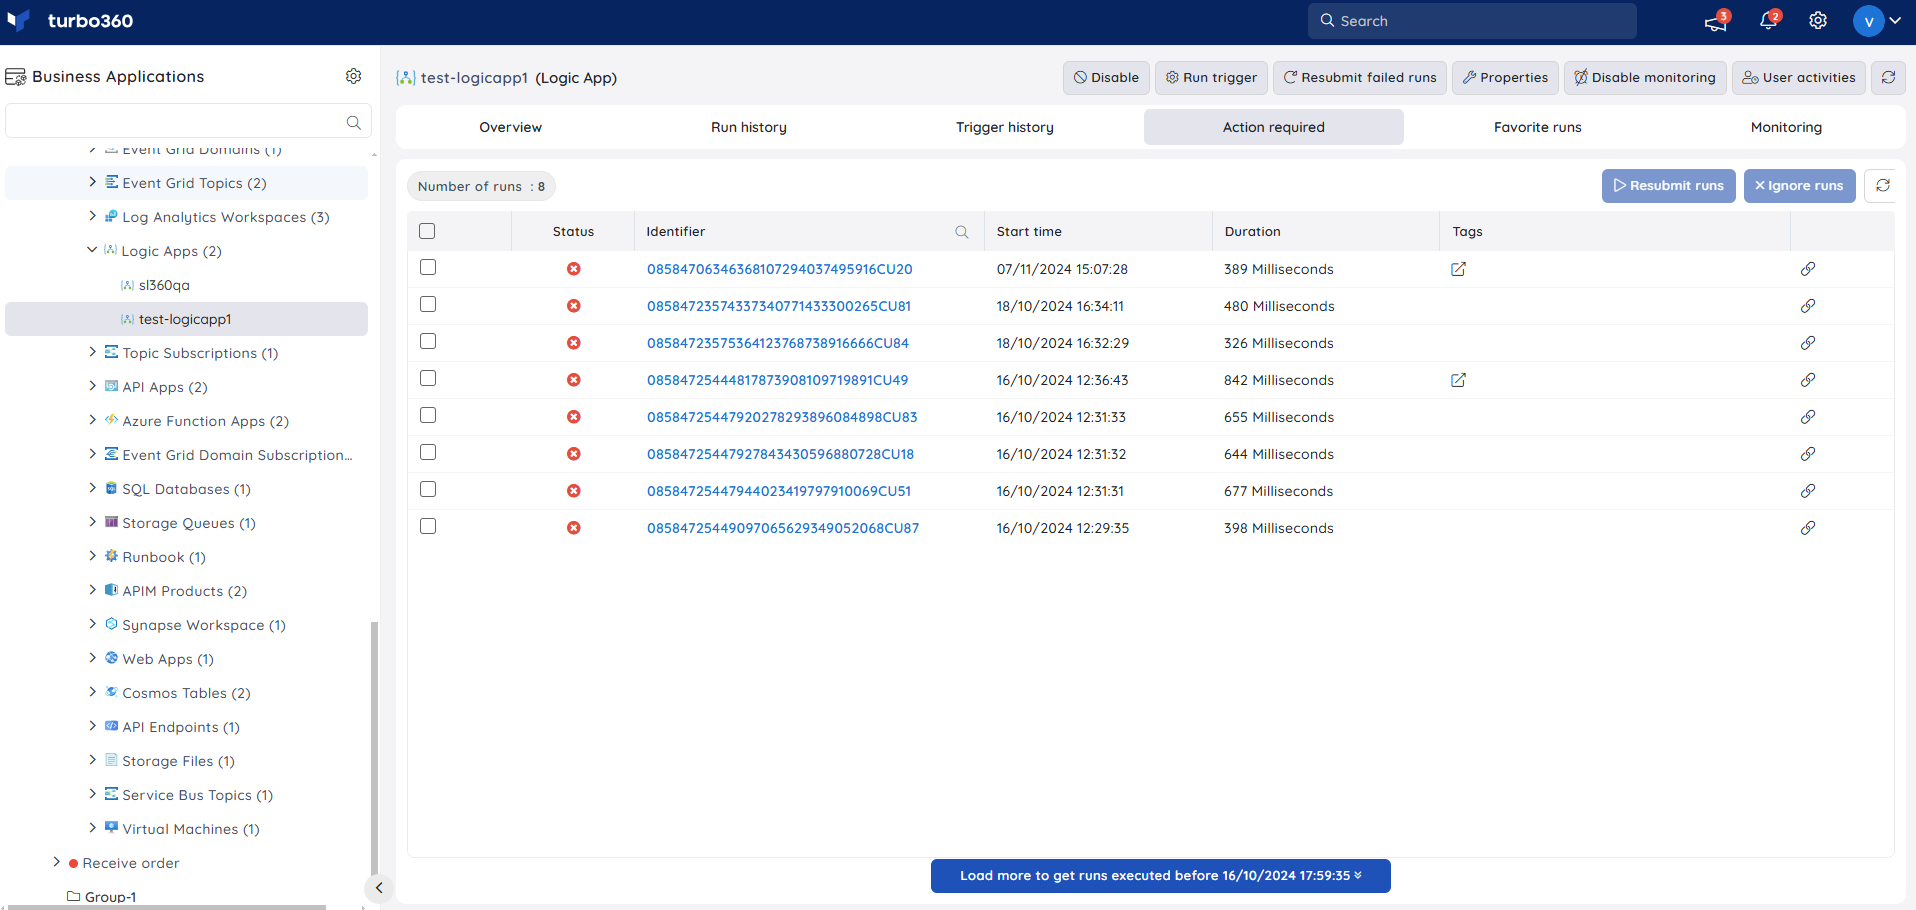
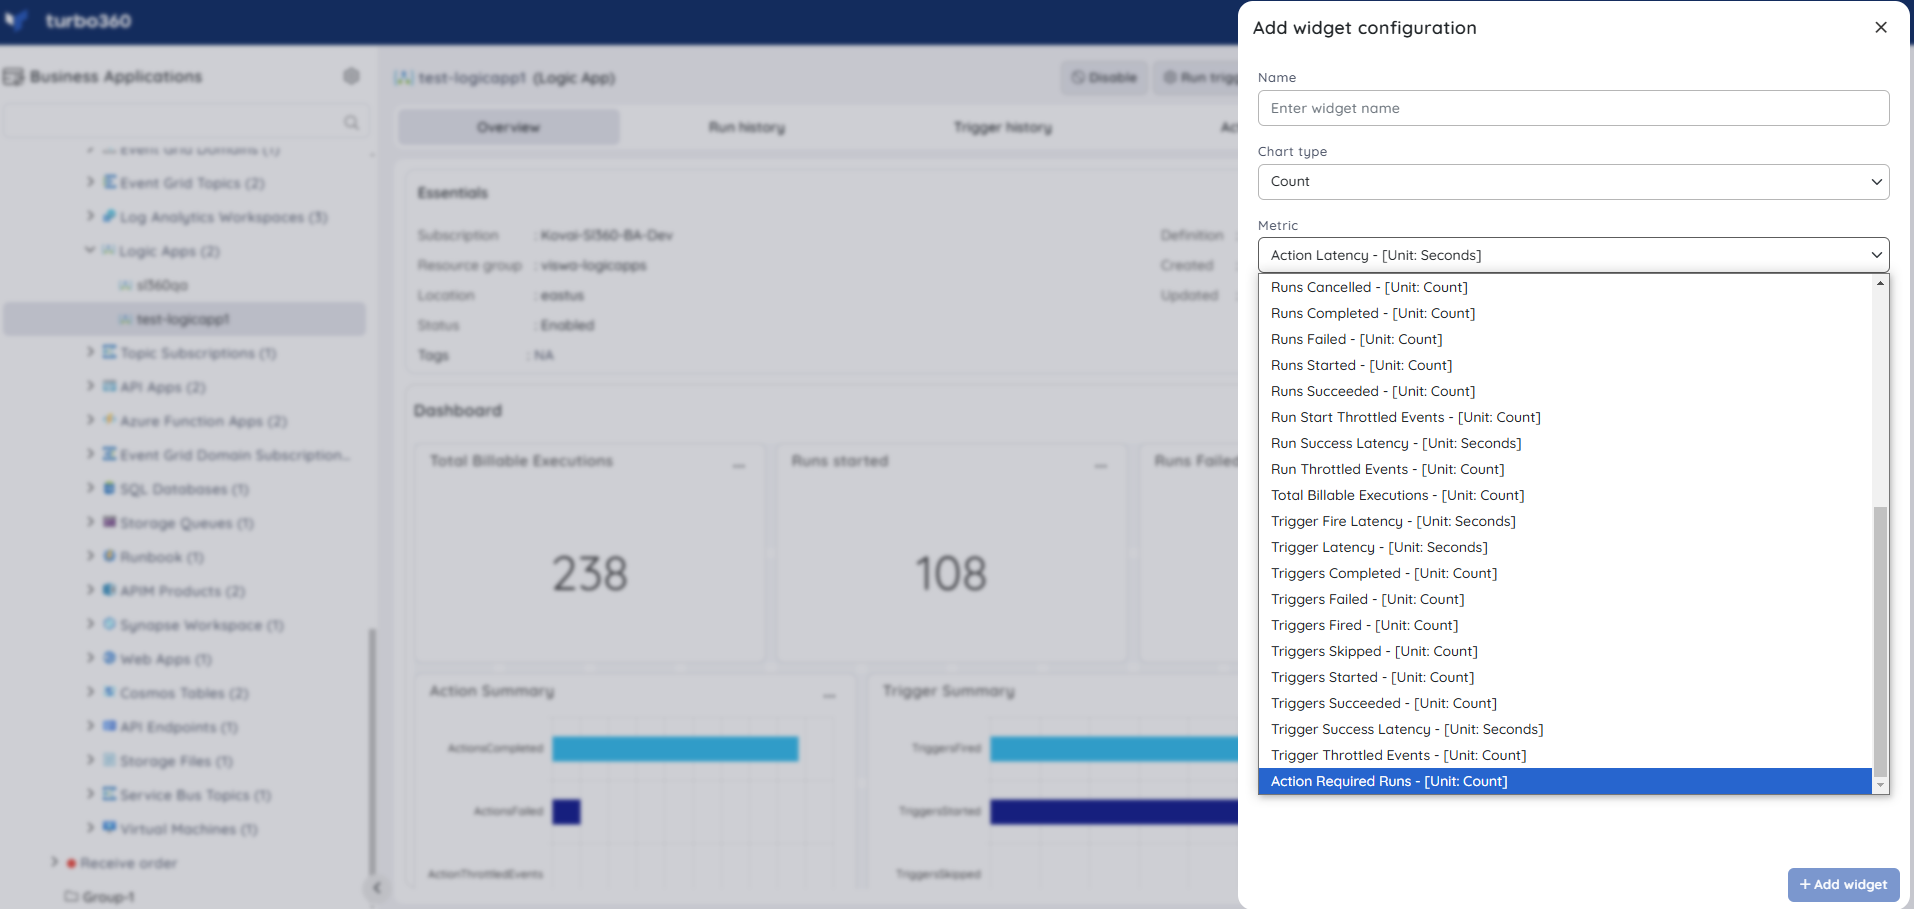
Turbo360 also offers a Count Chart widget for Action required runs, showing the number of failed runs requiring action within a specified interval. Resubmit from Turbo360 (not the Azure portal) to keep this widget accurate.
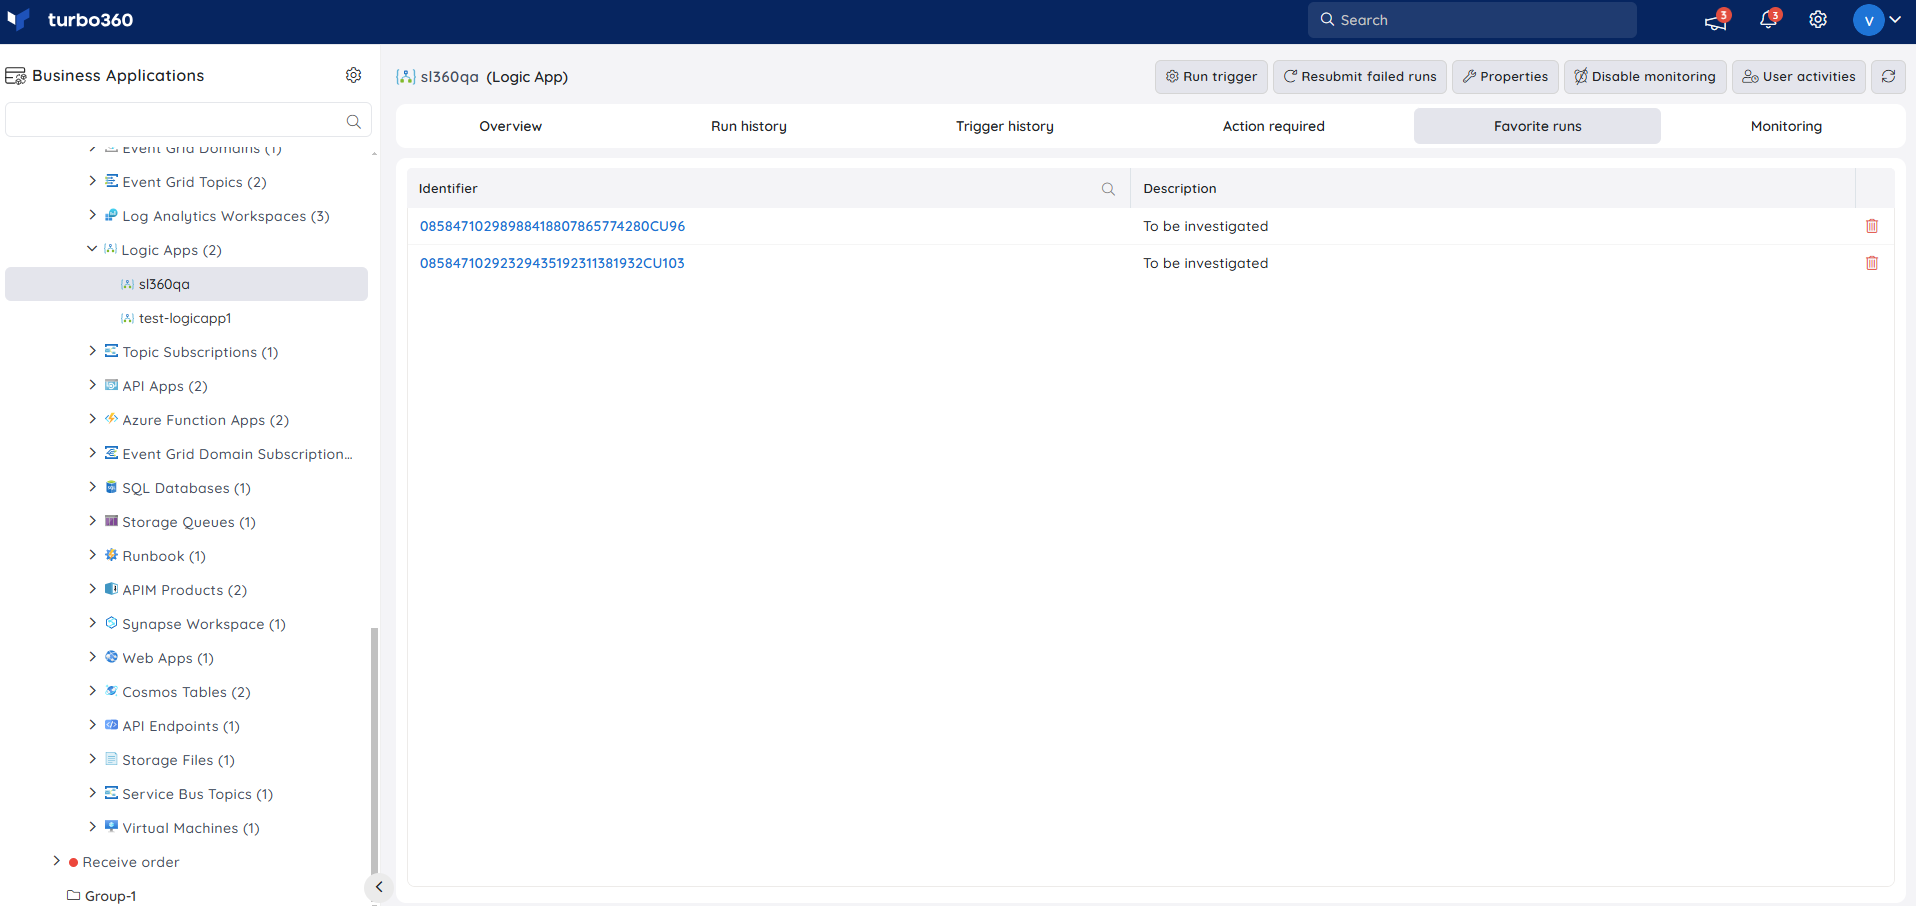
Favorite runs
- Mark as favorite — mark frequently used runs as favorites, with an optional description, from either Run history or Action required. Multiple runs can be favorited at once, and removed from the Favorite runs tab. Use this when you regularly revisit the same runs for reference.
Inline task to resubmit failed runs
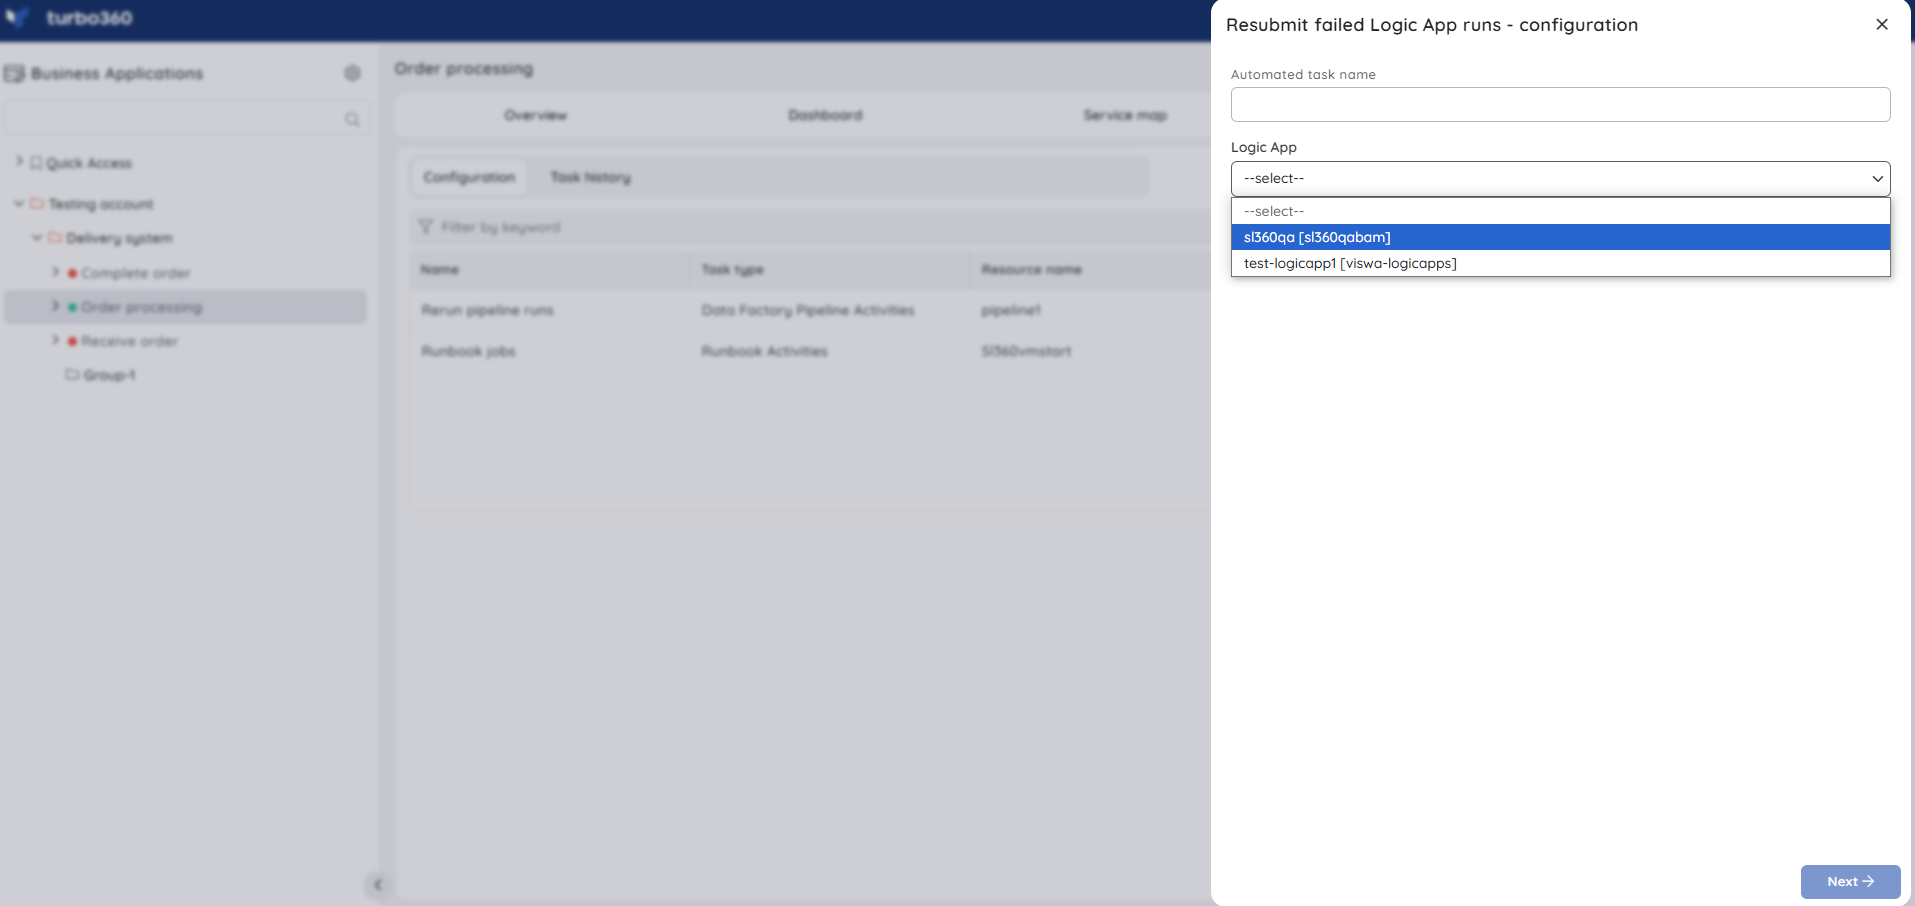
- Inline task — quickly resubmit runs that failed within a specified number of hours (minimum 1 hour), directly from the Logic App section. Use this when you need an immediate, one-off resubmission without configuring a recurring schedule.
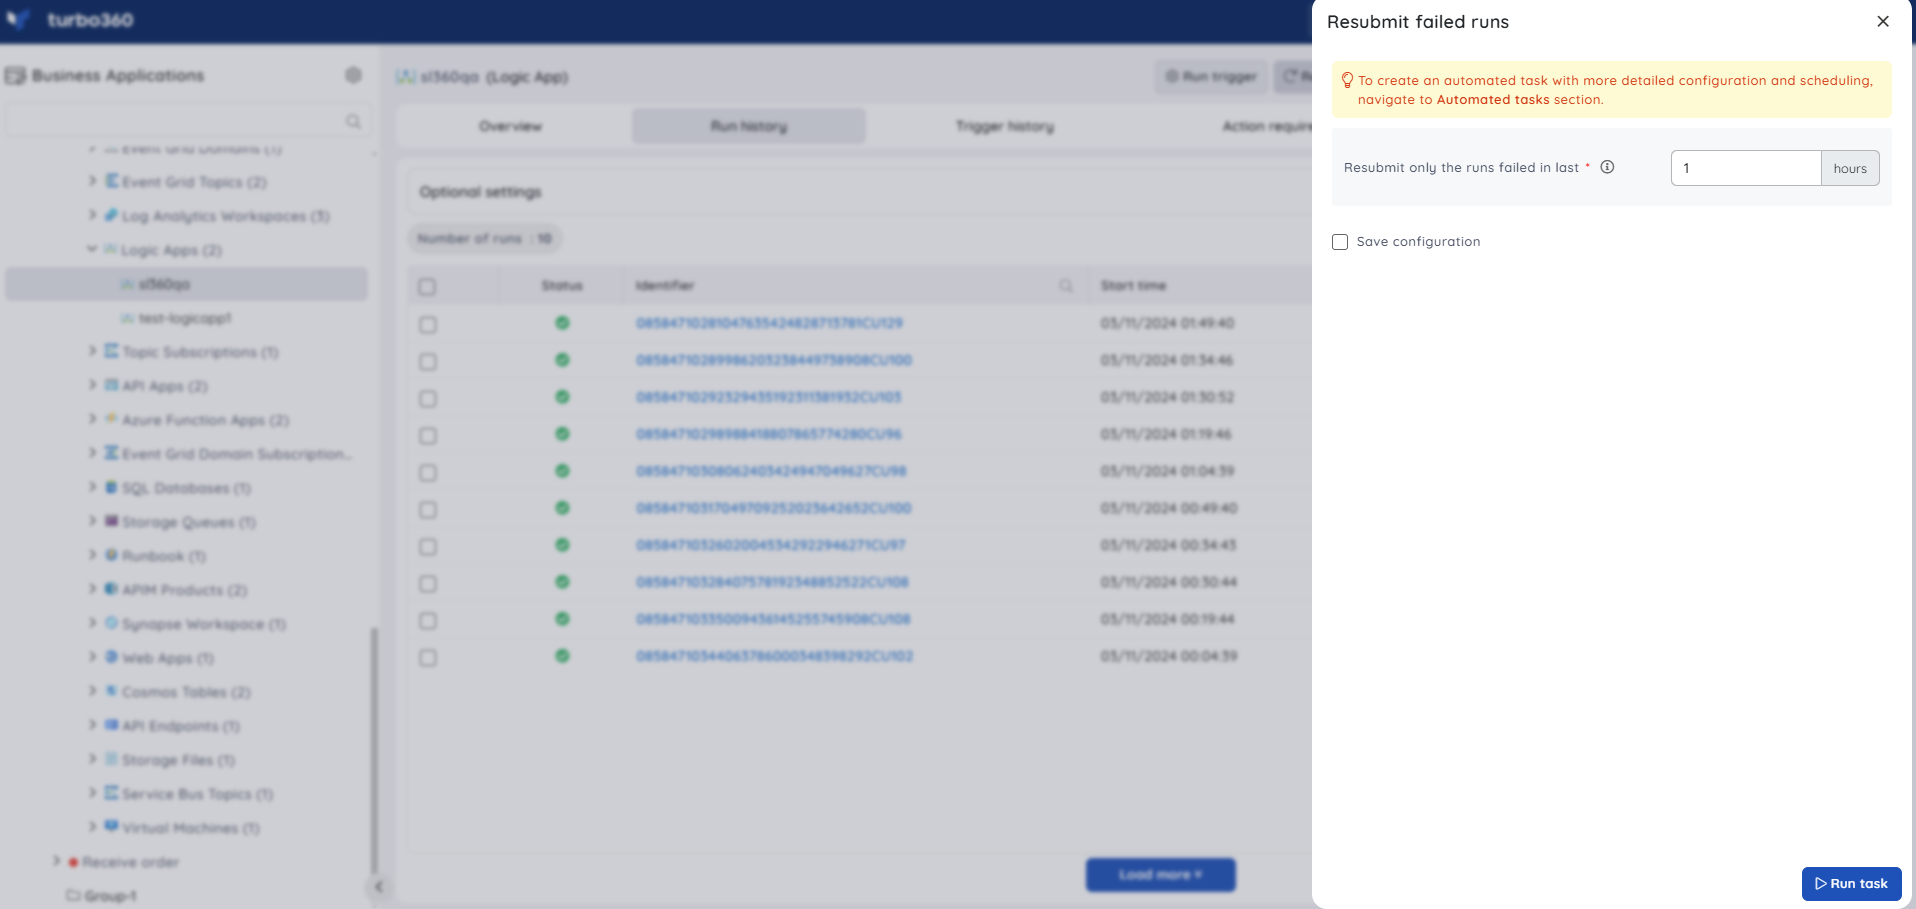
Task status can be viewed under Automated Tasks -> Task history.
Note:
- Users can use this feature to quickly create a task that runs immediately.
- Navigate to the Automated Tasks section in Turbo360 to create a task with a more detailed configuration, schedule tasks to run at a specific time, or automate the task to run on the specified hours, days, and more.
The Automated Task feature also lets you schedule automatic resubmission of failed runs for a specific duration and Logic App — for example, automatically resubmitting failed runs in an employee-joining workflow that posts to a Service Bus Queue, Azure Function, and Storage Table.
Resource dashboard
The Logic App dashboard surfaces execution, consumption, and latency signals so you can spot reliability or performance issues without leaving Turbo360.
| Widget | What it shows |
|---|---|
| Total Billable Executions | Volume of billable executions for the Logic App. |
| Runs started | Count of runs that started. |
| Runs Failed | Count of runs that failed. |
| Run Failure Percentage | Percentage of runs that failed out of total runs. |
| Action Summary | Summary of action-level activity across runs. |
| Trigger Summary | Summary of trigger-level activity. |
| Run Summary | At-a-glance summary of overall run activity. |
| Action Success Vs Failure | Compares successful actions against failed actions. |
| Trigger Success Vs Failure | Compares successful triggers against failed triggers. |
| Run Success Vs Failure | Compares successful runs against failed runs. |
| Consumption By Type | Breaks down resource consumption by type. |
| Failure Summary | At-a-glance summary of failures across the Logic App. |
| Performance By Latency | Performance breakdown by execution latency. |
| Success Latency | Latency of successful executions. |
You can add, remove, or reconfigure widgets to focus on the metrics most relevant to your support scenario.
.png)
Metrics
The Metrics tab lets you chart any Azure metric for your Logic App directly in Turbo360, without switching to the Azure portal. Use it to track action latency, run failure rates, and trigger counts alongside your dashboard widgets, giving you a complete picture of execution health across any time window.
Use the following controls to build your chart:
| Control | Description |
|---|---|
| Select metric | Choose the Azure metric to visualize (e.g. Runs Started, Runs Completed, Runs Failed, Actions Latency, Triggers Fired). |
| Aggregation | Set the aggregation method: Average, Min, Max, Total, or Count. |
| Time range | Set the time window for the data (e.g. Last 24 hours, Last 7 days). |
| Granularity | Set the data point resolution (e.g. 1 minute, 1 hour). |
| Chart type | Choose the visualization type: Line or Bar. |
Click Apply to render the chart.
.png)
Monitoring
Logic App metrics and runs count can be monitored using Turbo360, configured under Logic App -> Monitoring.
Monitoring rules are saved per resource, and the monitoring state is reflected after every monitoring cycle.
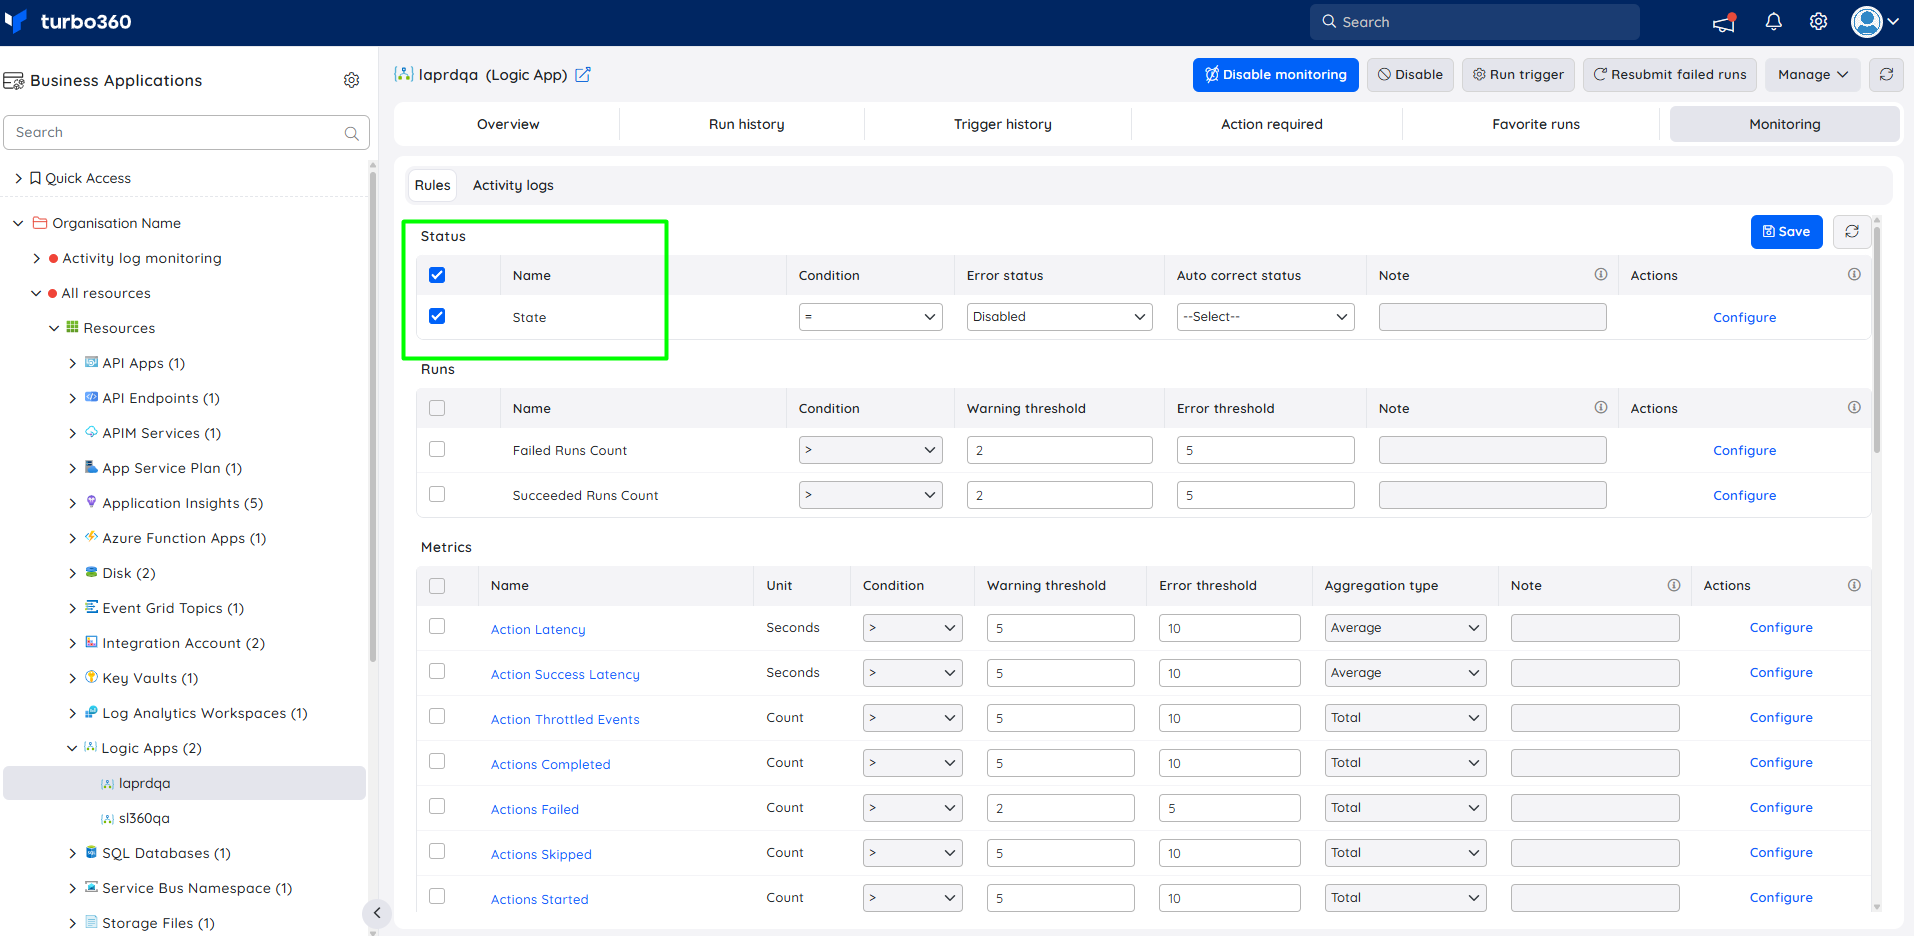
State monitoring
The status of a Logic App can be monitored to track its current state and ensure it is running as expected.
- Navigate to Logic App -> Monitoring.
- Configure the state rule under Status with the desired threshold.
- Click Save.
Metric monitoring
Logic App metrics can be monitored to gain visibility into performance, usage patterns, and overall execution behavior.
- Navigate to Logic App -> Monitoring to configure the monitoring rules for Logic Apps.
- Select the necessary monitoring metrics and configure the threshold values.
- Click Save.
The threshold values can also be provided with any metric name, defining the monitoring rule to be violated when the metric value configured at the threshold field is met.
.png)
Runs monitoring
The success and failure counts for a Logic App can be monitored to track execution outcomes and overall workflow health.
- Navigate to Logic App -> Monitoring to configure the monitoring rules for Logic Apps.
- Choose between Failed Runs Count and Succeeded Runs Count under Runs and configure the threshold values.
- Click Save to apply monitoring rules.
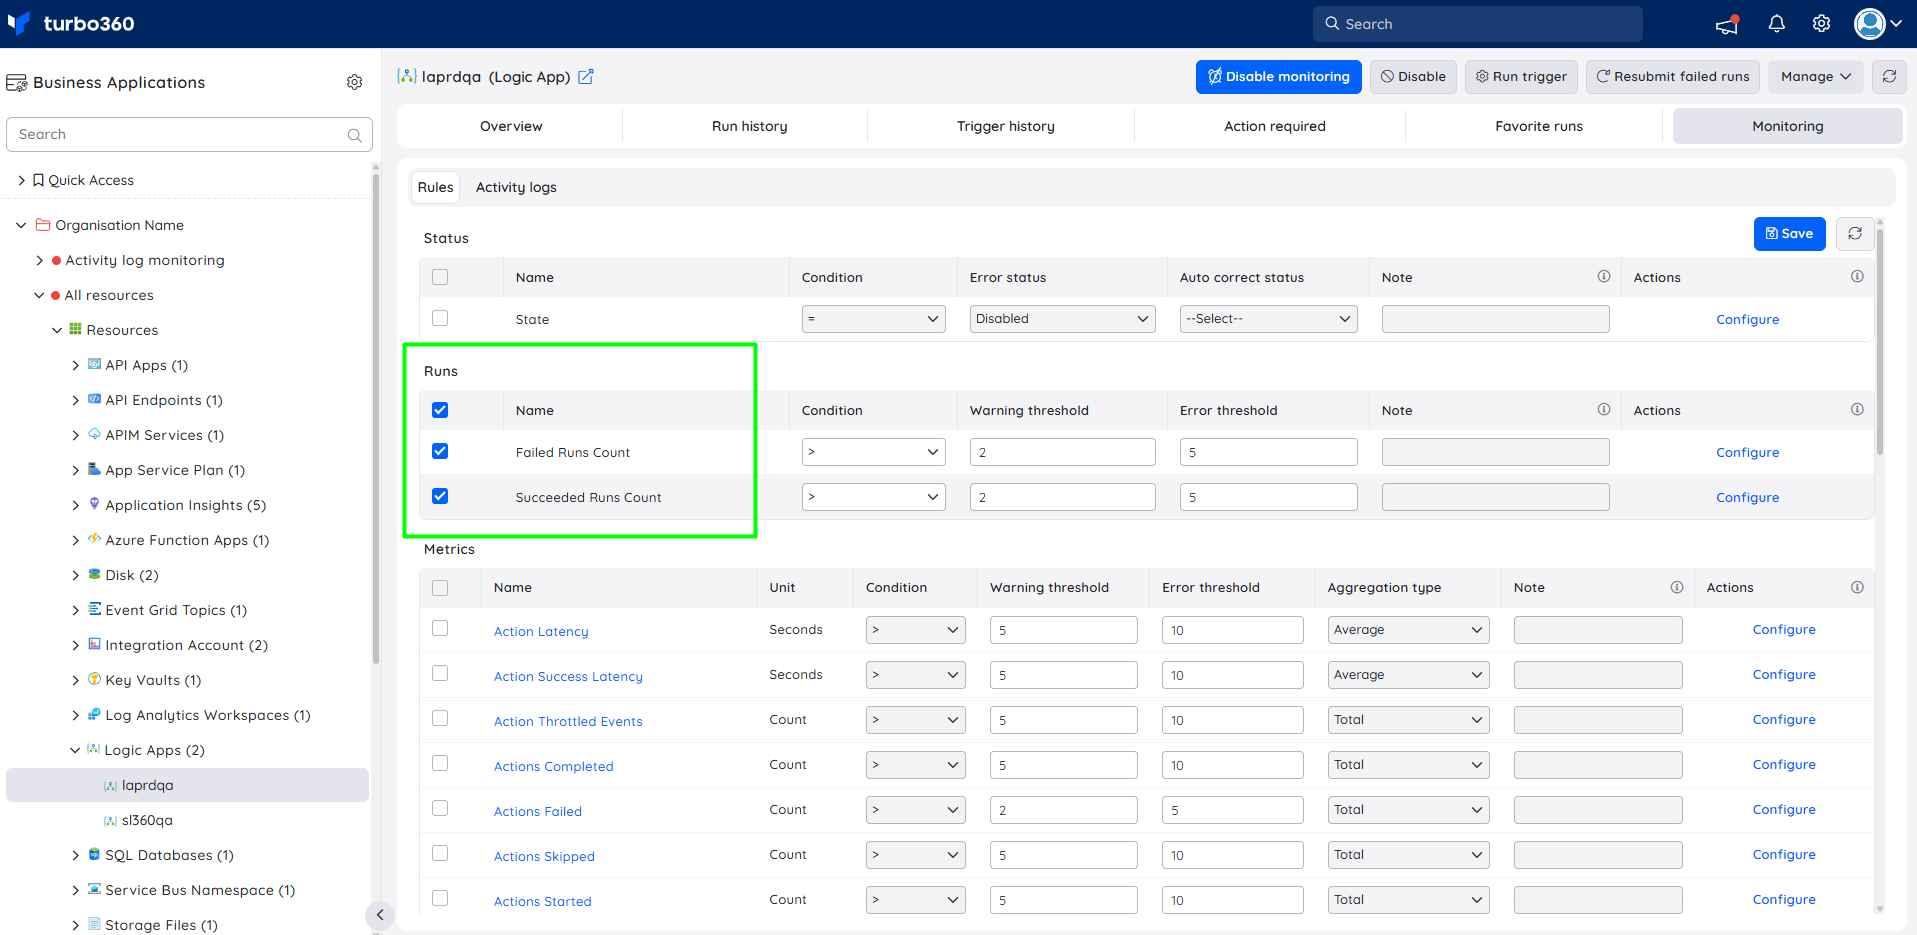
Runs monitoring will be initiated, and the failed runs health state and the failure count will be reflected after every monitoring cycle.
Monitoring recommendations
This section covers common settings for monitoring Logic App consumption.
State — the picture below shows how to configure monitoring for the state of your Logic App to be in the enabled state. You can also configure an auto-correct state to make Turbo360 change it back to enabled if it is disabled.
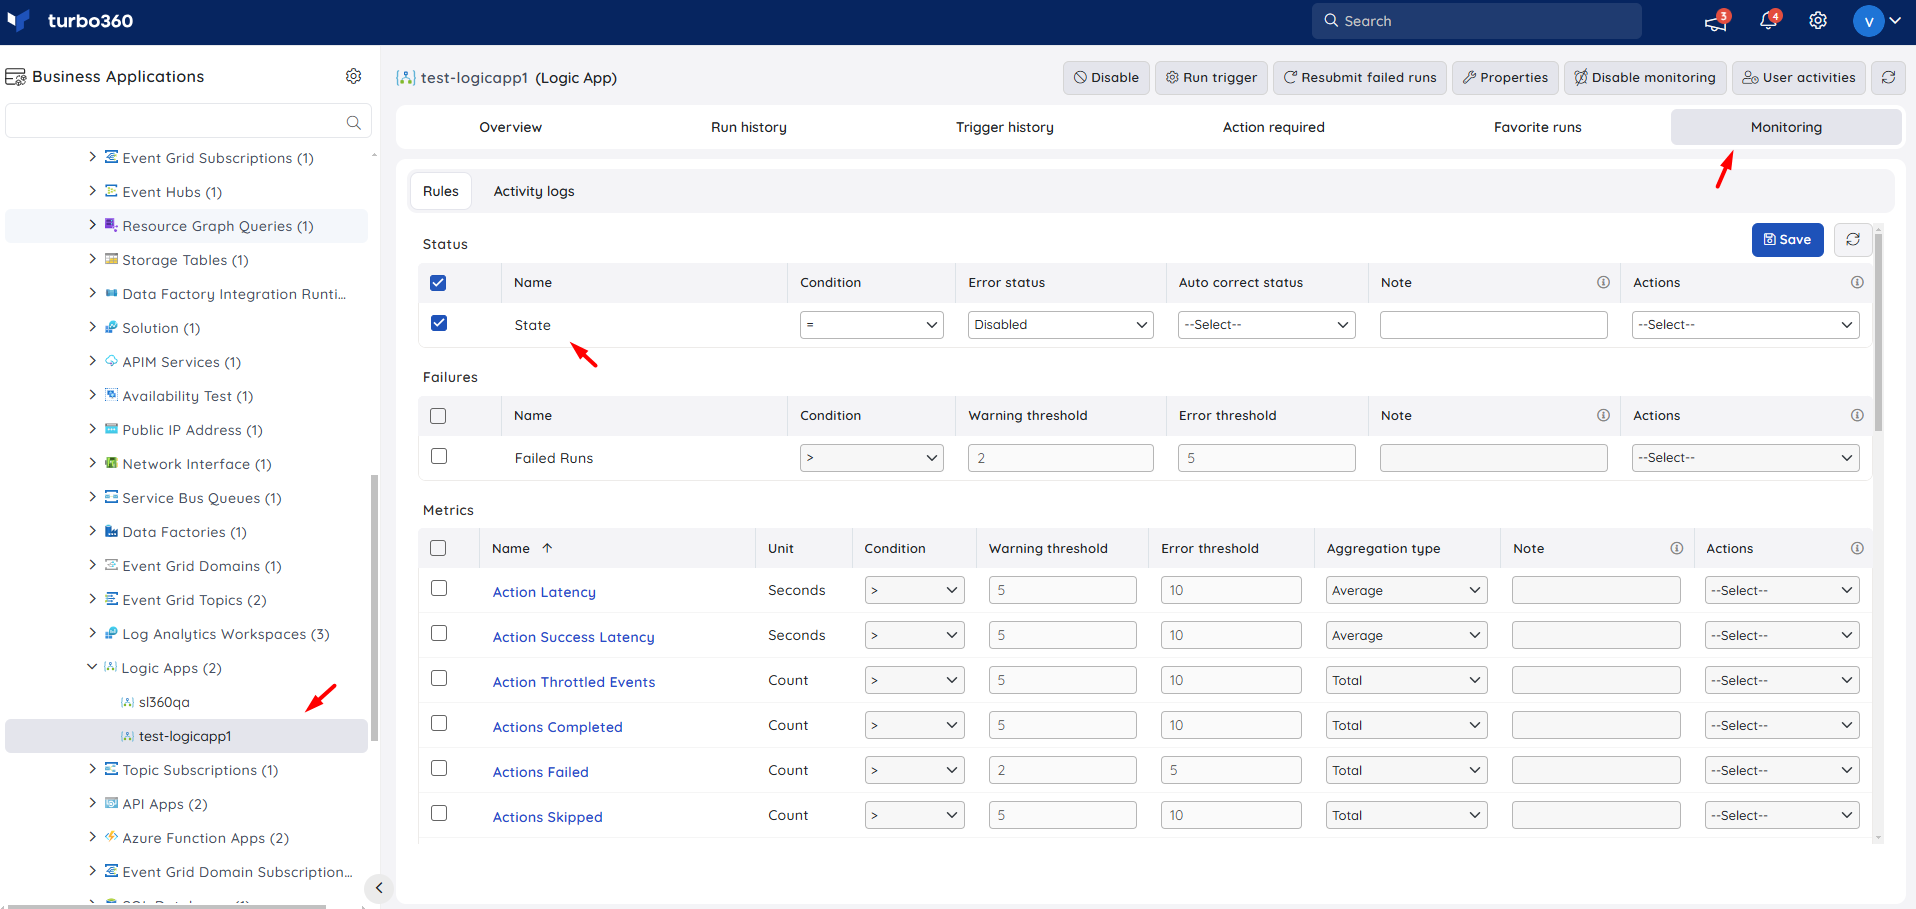
Failures — failure monitoring examines the run history API for your Logic App. You can configure the number of errors since the last monitoring check that will trigger alerts indicating that your Logic App is unhealthy. Adjust the threshold based on the specific needs of your scenario.
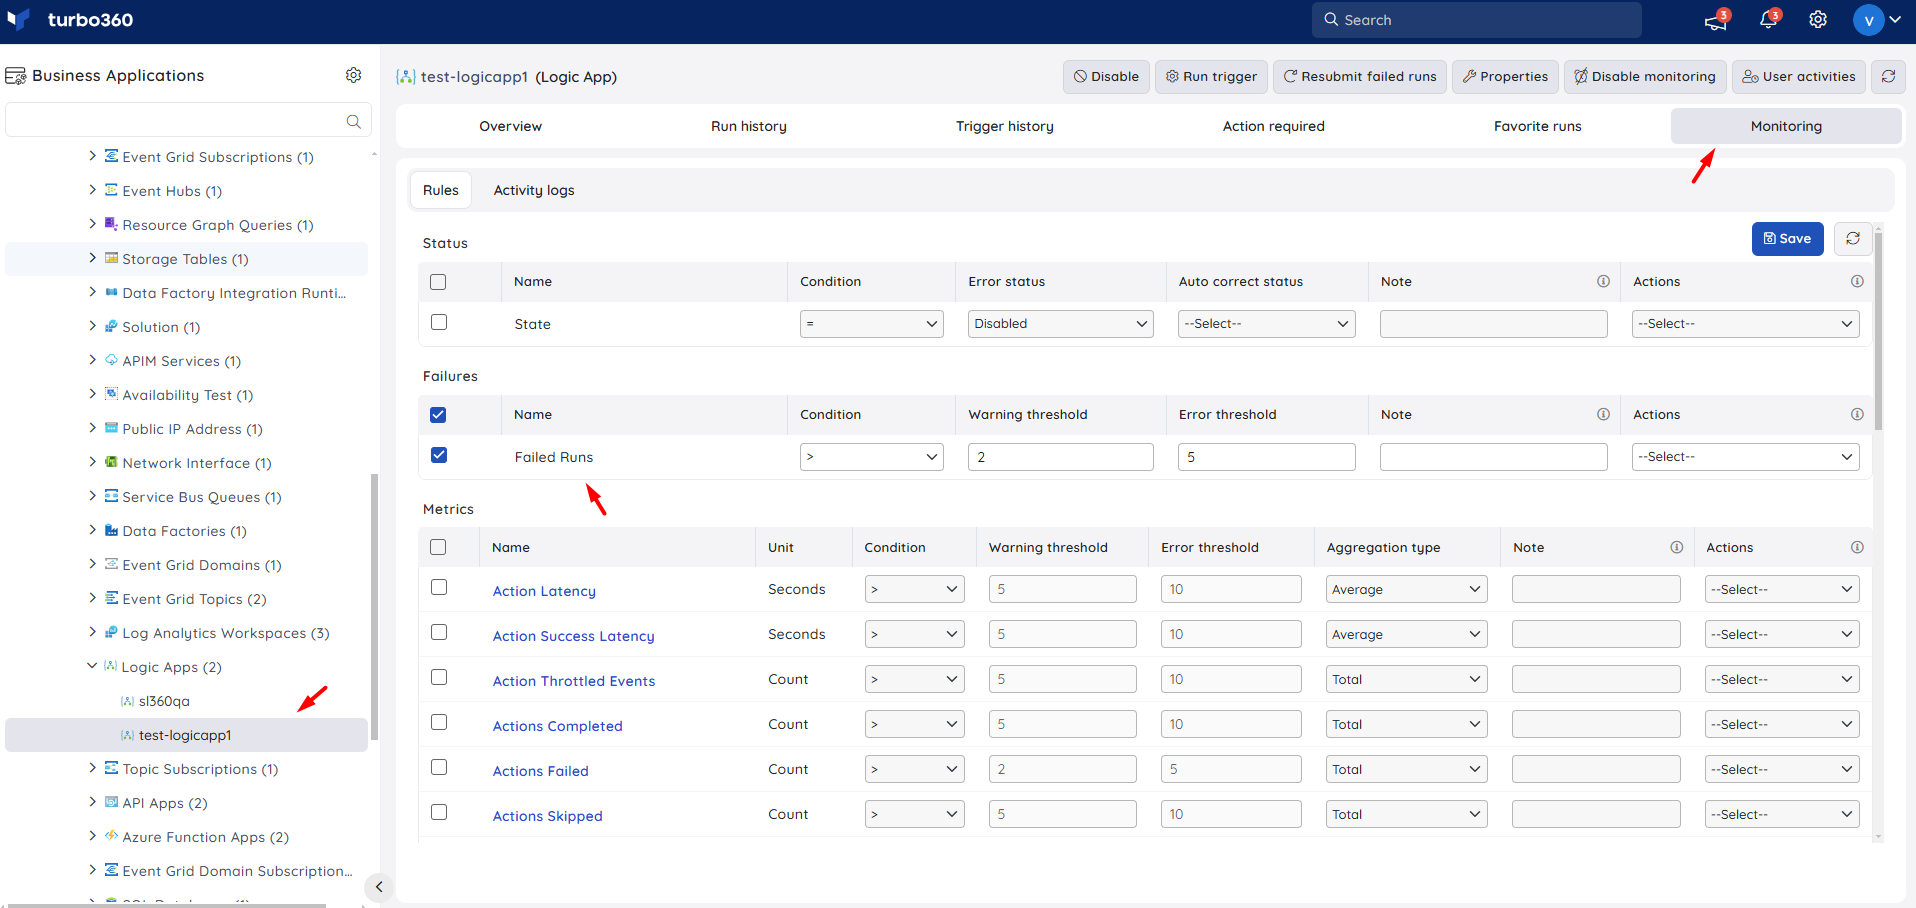
Metrics — since Turbo360 already checks the run history API for failures, the metric counter is not required for monitoring. However, there are still several metrics you may wish to monitor:
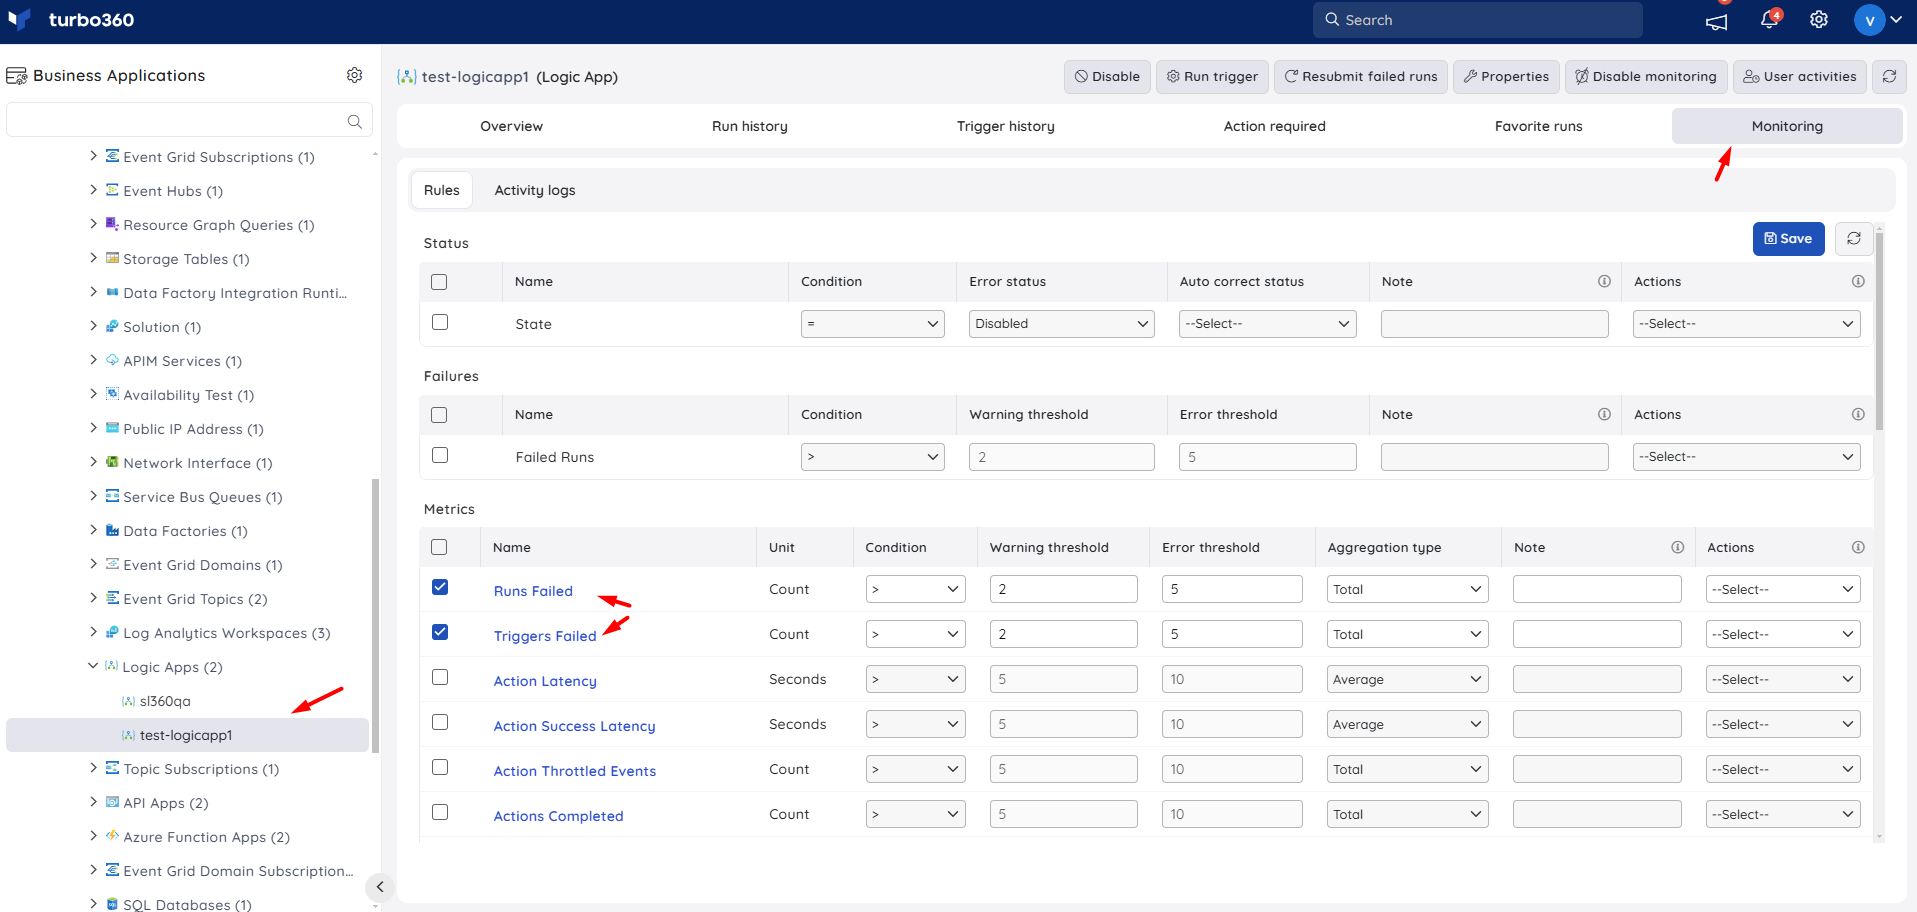
- Run Latency — the average duration of your Logic App runs. Alert if this metric changes from the normal value.
- Triggers Failed — a common metric if you are doing something like polling Service Bus; a connectivity error would show this counter increase.
You can also monitor the plan that hosts the Logic App, and individual workflows within it, separately.
Troubleshooting
- Resubmit option does not appear for a failed run
Cause: The role applied to the Business Application lacks the Reprocess permission.
Fix: Confirm the role has Reprocess access, then retry. - Action required widget shows inaccurate counts
Cause: Some failed runs were resubmitted from the Azure portal instead of Turbo360.
Fix: Resubmit failed runs from Turbo360 going forward to keep the widget accurate. - State monitoring rule does not auto-correct
Cause: No auto-correct status was configured on the rule.
Fix: Edit the rule and specify an auto-correct status. - Trigger history does not show a specific trigger
Cause: A filter is applied that excludes the trigger or its status.
Fix: Clear or adjust the trigger and status filters in Trigger history.
Related articles
Was this article helpful?