

Logic App (Standard)
- 05 Aug 2026
- 5 Minutes to read
- Print
- DarkLight
- Download PDF
Logic App (Standard)
- Updated on 05 Aug 2026
- 5 Minutes to read
- Print
- DarkLight
- Download PDF
Article summary
Did you find this summary helpful?
Thank you for your feedback!
Overview
Logic App (Standard) is a single-tenant offering that lets you run workflows from any location. The Standard resource type introduces a resource structure that can host multiple workflows, similar to an Azure Function App, differing from Logic App (Consumption), which has a one-to-one mapping between a logic app and a workflow.
Business value
Managing Logic App (Standard) status and monitoring its hosting plan from Turbo360 gives you a single place to control the app that hosts your workflows, reducing the time to detect and respond to host-level issues.
How it works
- Workflows in the same Logic App and tenant share compute and processing resources due to their close proximity, resulting in better performance.
- Once associated with a Business Application, the app's status and monitoring become directly manageable from Turbo360. Turbo360 also provides features that can be configured separately for each individual workflow within the app.
Permissions
Access to Logic App (Standard) actions is controlled through RBAC when adding a role to a Business Application.
| Permission | Description |
|---|---|
| Read | View status, the resource dashboard, and monitoring rules. |
| Manage | Start, Stop, and Restart the app, and configure monitoring rules. |
Operations
Turbo360 lets you control the lifecycle of Logic App (Standard) directly, without switching to the Azure portal.
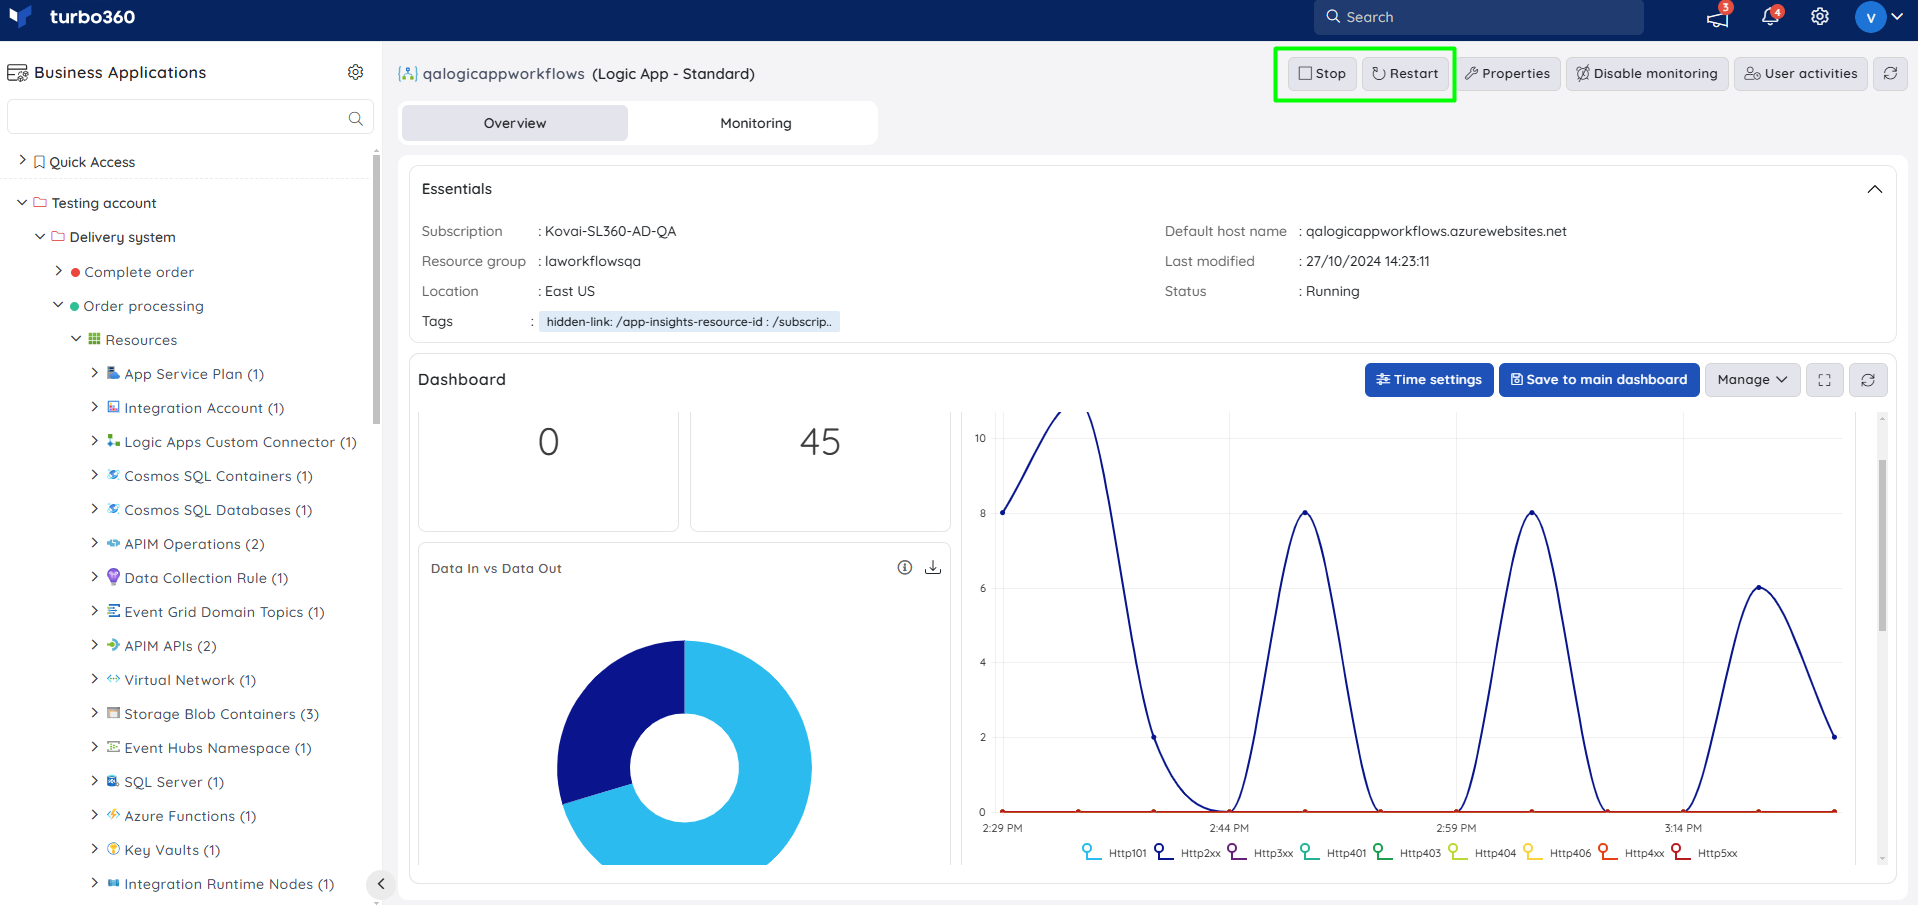
Start, Stop, and Restart
- Start — bring a stopped Logic App (Standard) online. Use this when workflows hosted on the app need to resume processing.
- Stop — shut down a running Logic App (Standard). Use this when the app is no longer needed, to control cost.
- Restart — stop and start the app in sequence. Use this when the app is unresponsive or needs a clean state.
Bulk operations
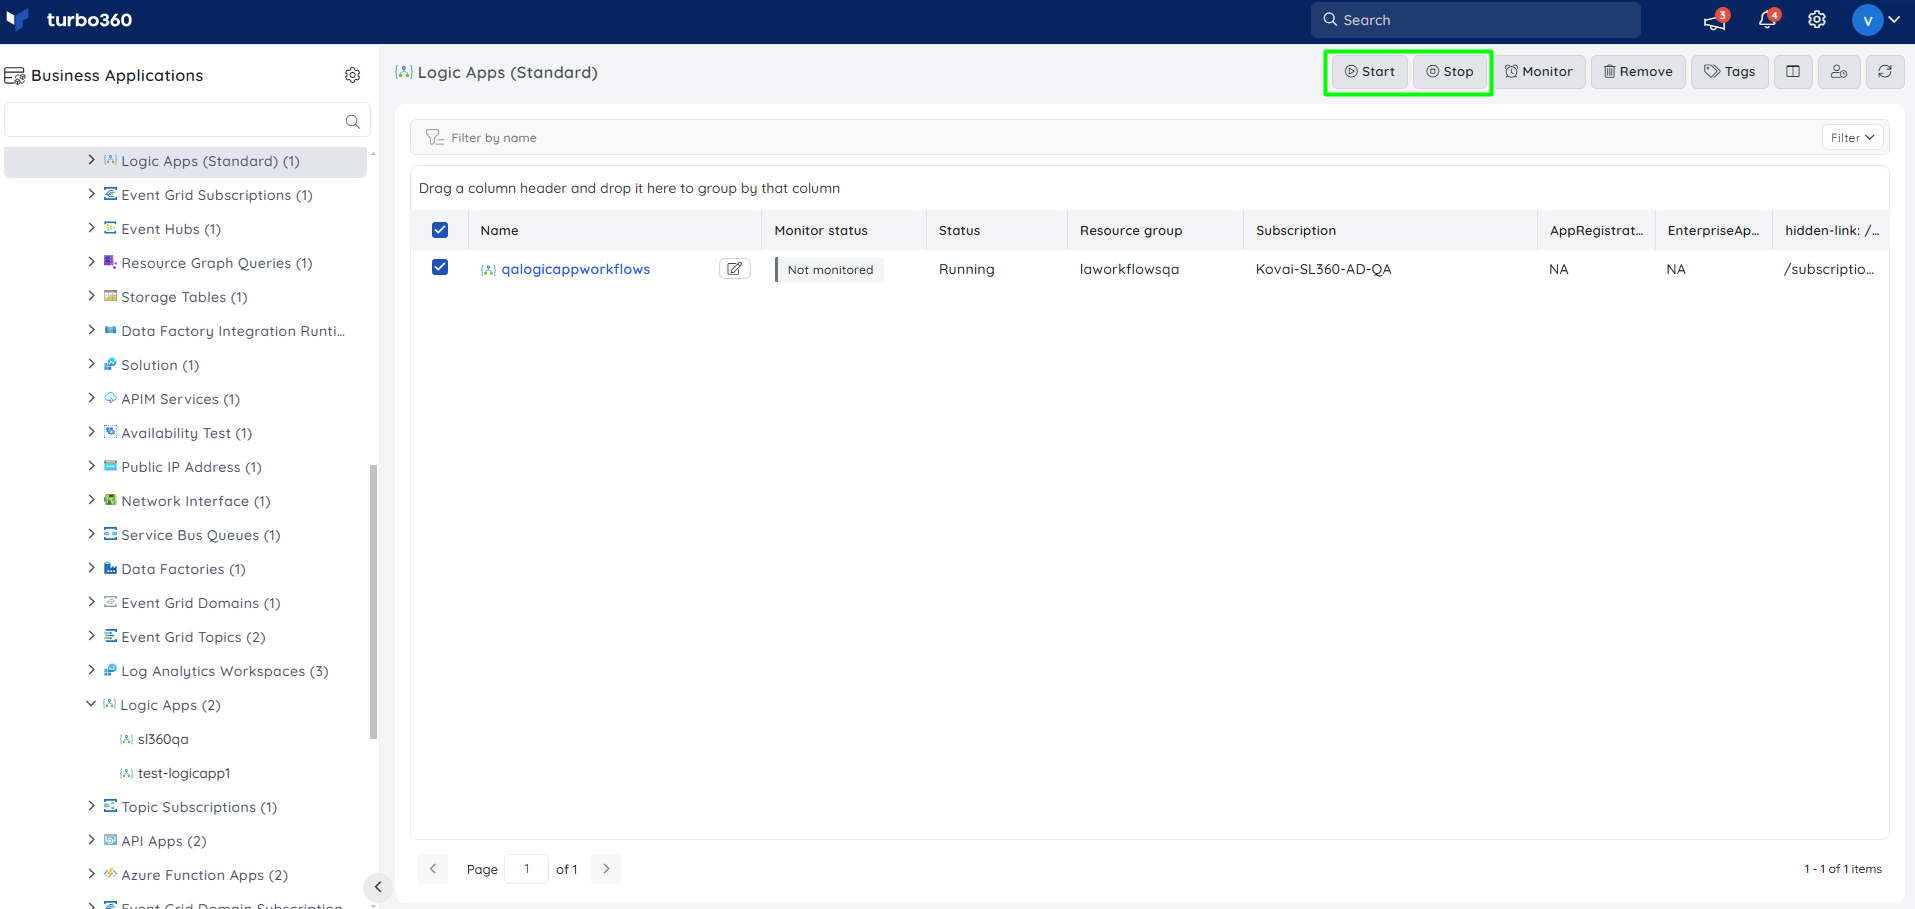
- Bulk Start/Stop — perform Start or Stop on multiple Logic App (Standard) resources at once. Use this when several apps need the same status change together, such as during planned maintenance.
Resource dashboard
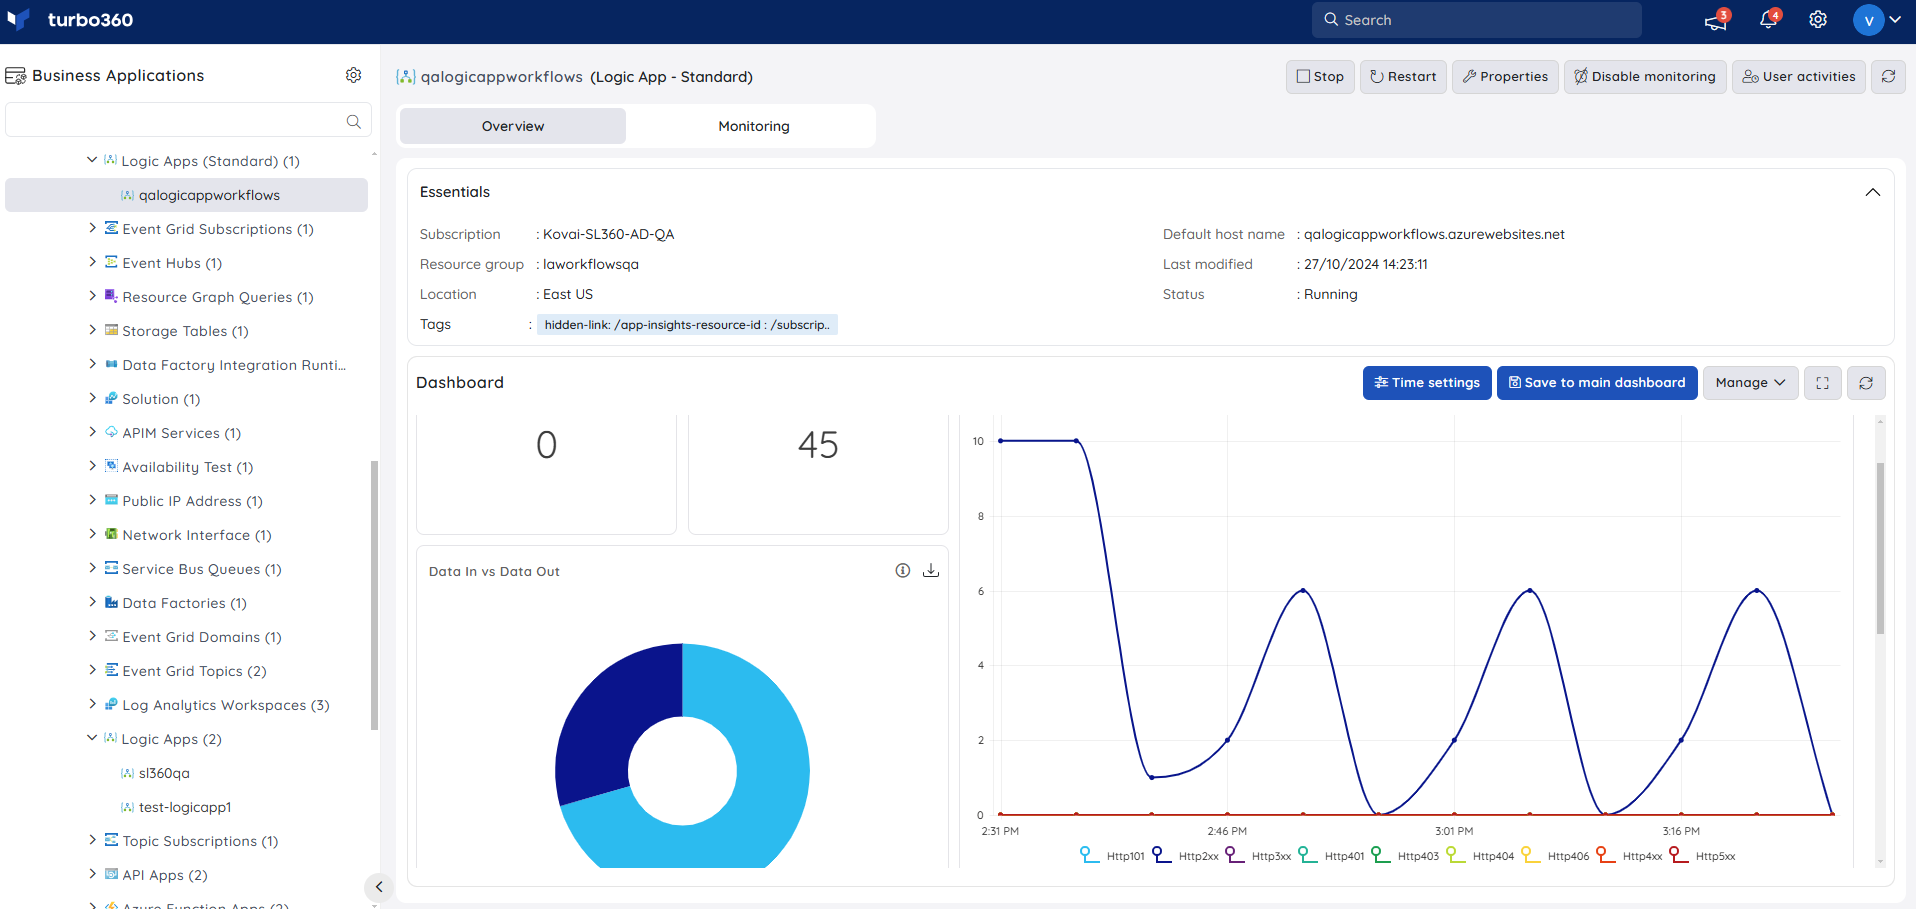
The Logic App (Standard) dashboard surfaces function execution, request, and resource signals so you can spot host-level performance issues without leaving Turbo360.
| Widget | What it shows |
|---|---|
| Function Execution Count | Volume of function executions on the app. |
| Requests Count | Volume of incoming requests to the app. |
| Http Errors | Count of HTTP errors returned by the app. |
| Data In vs Data Out | Compares inbound data volume against outbound data volume. |
| Garbage Collections | Count of garbage collection events, useful for spotting memory pressure. |
| IO Read vs IO Write | Compares disk read volume against write volume. |
Metrics
The Metrics tab surfaces function execution, request, and memory data for Logic App (Standard), giving you visibility into host-level performance trends across all workflows running on the app. Use the Metrics tab to identify whether elevated HTTP errors or garbage collection activity correlate with a specific workflow change or deployment.
You can add, remove, or reconfigure widgets to focus on the metrics most relevant to your support scenario.
Monitoring
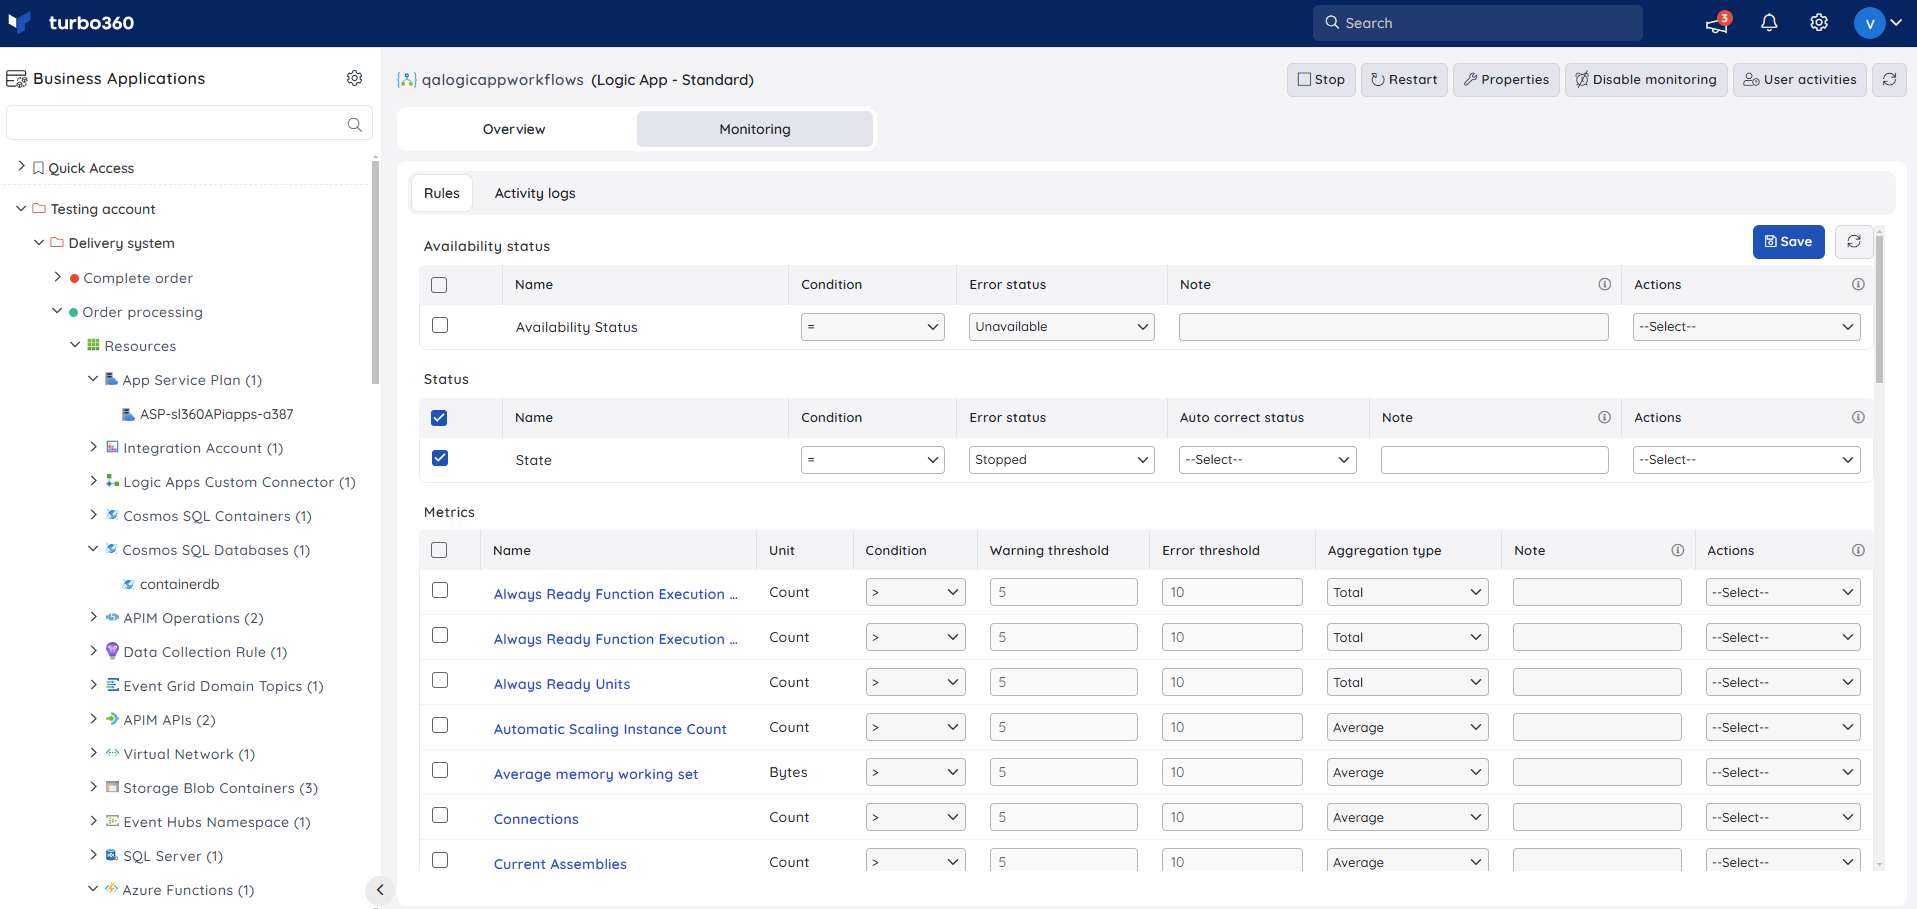
Logic App (Standard) supports availability status, state, and metric monitoring rules, configured under Logic App (Standard) -> Monitoring.
Monitoring rules are saved per resource, and the monitoring state is reflected after every monitoring cycle.
Availability status monitoring
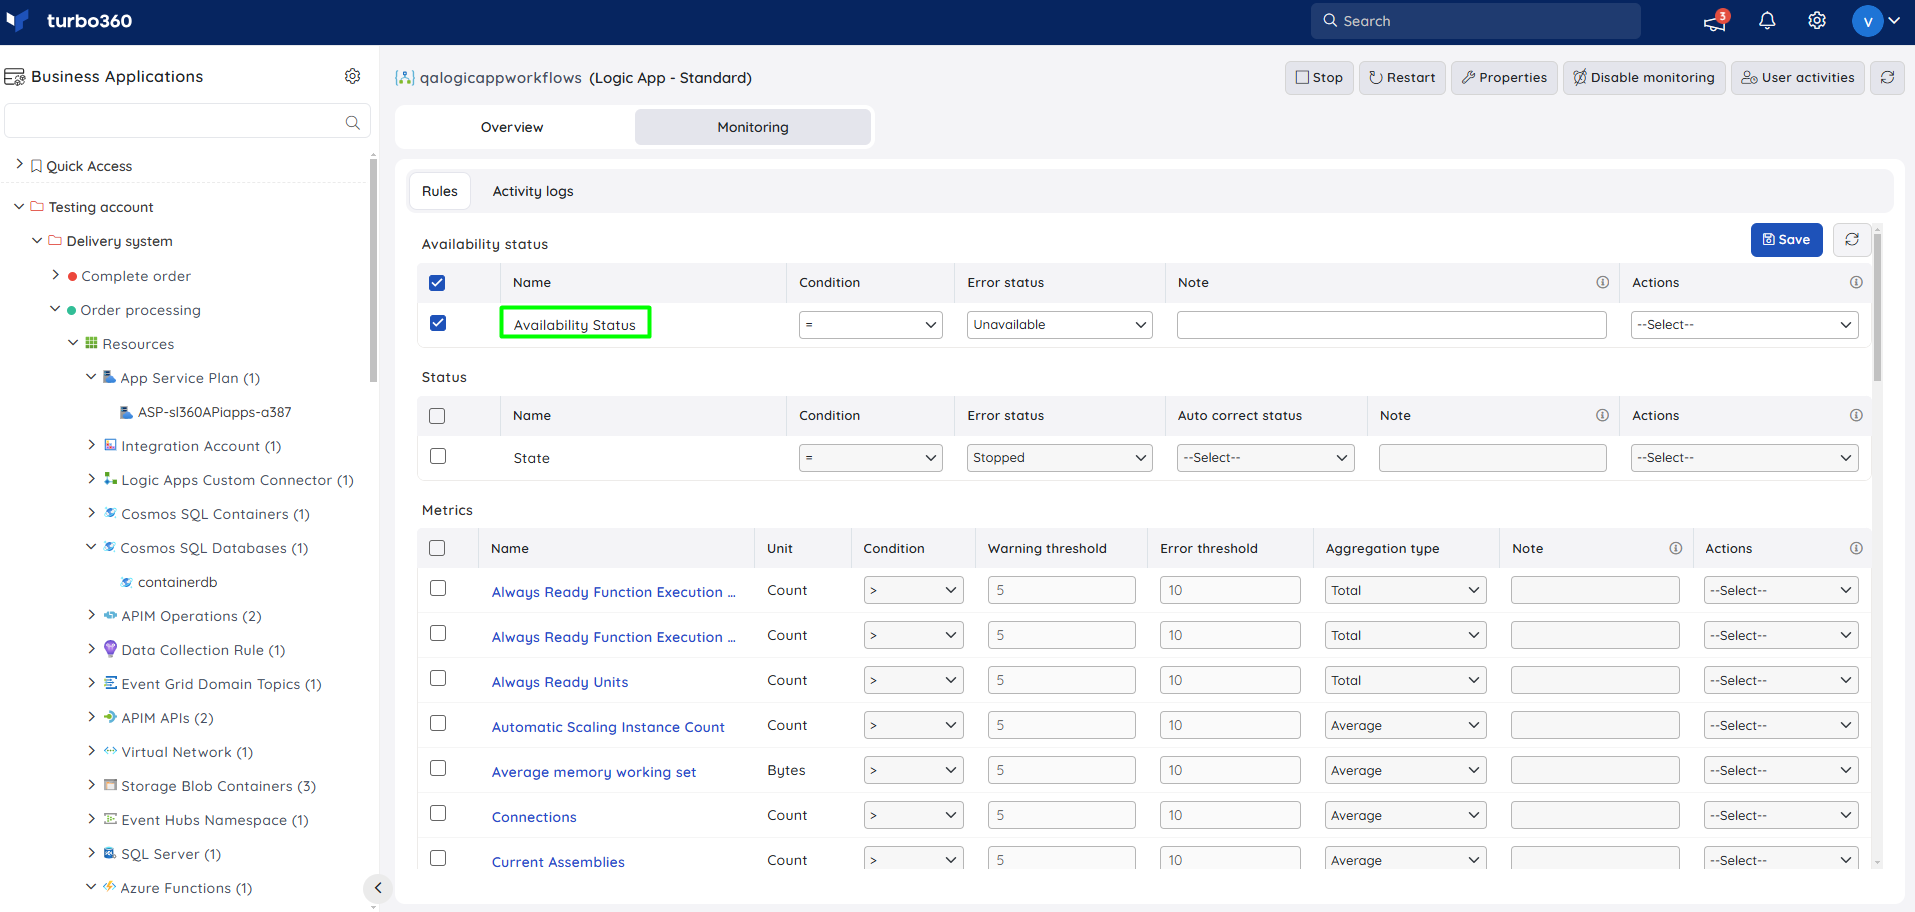
The resource health status of Logic App (Standard) can be monitored by using the Availability status rule.
- Navigate to Logic App (Standard) -> Monitoring.
- Configure the Availability status rule with the desired threshold.
- Click Save.
State monitoring
The current status of a Logic App (Standard) can be monitored with the help of the State monitoring rule under the Status category.
- Navigate to Logic App (Standard) -> Monitoring.
- Configure the State rule under Status with the desired threshold.
- Click Save.
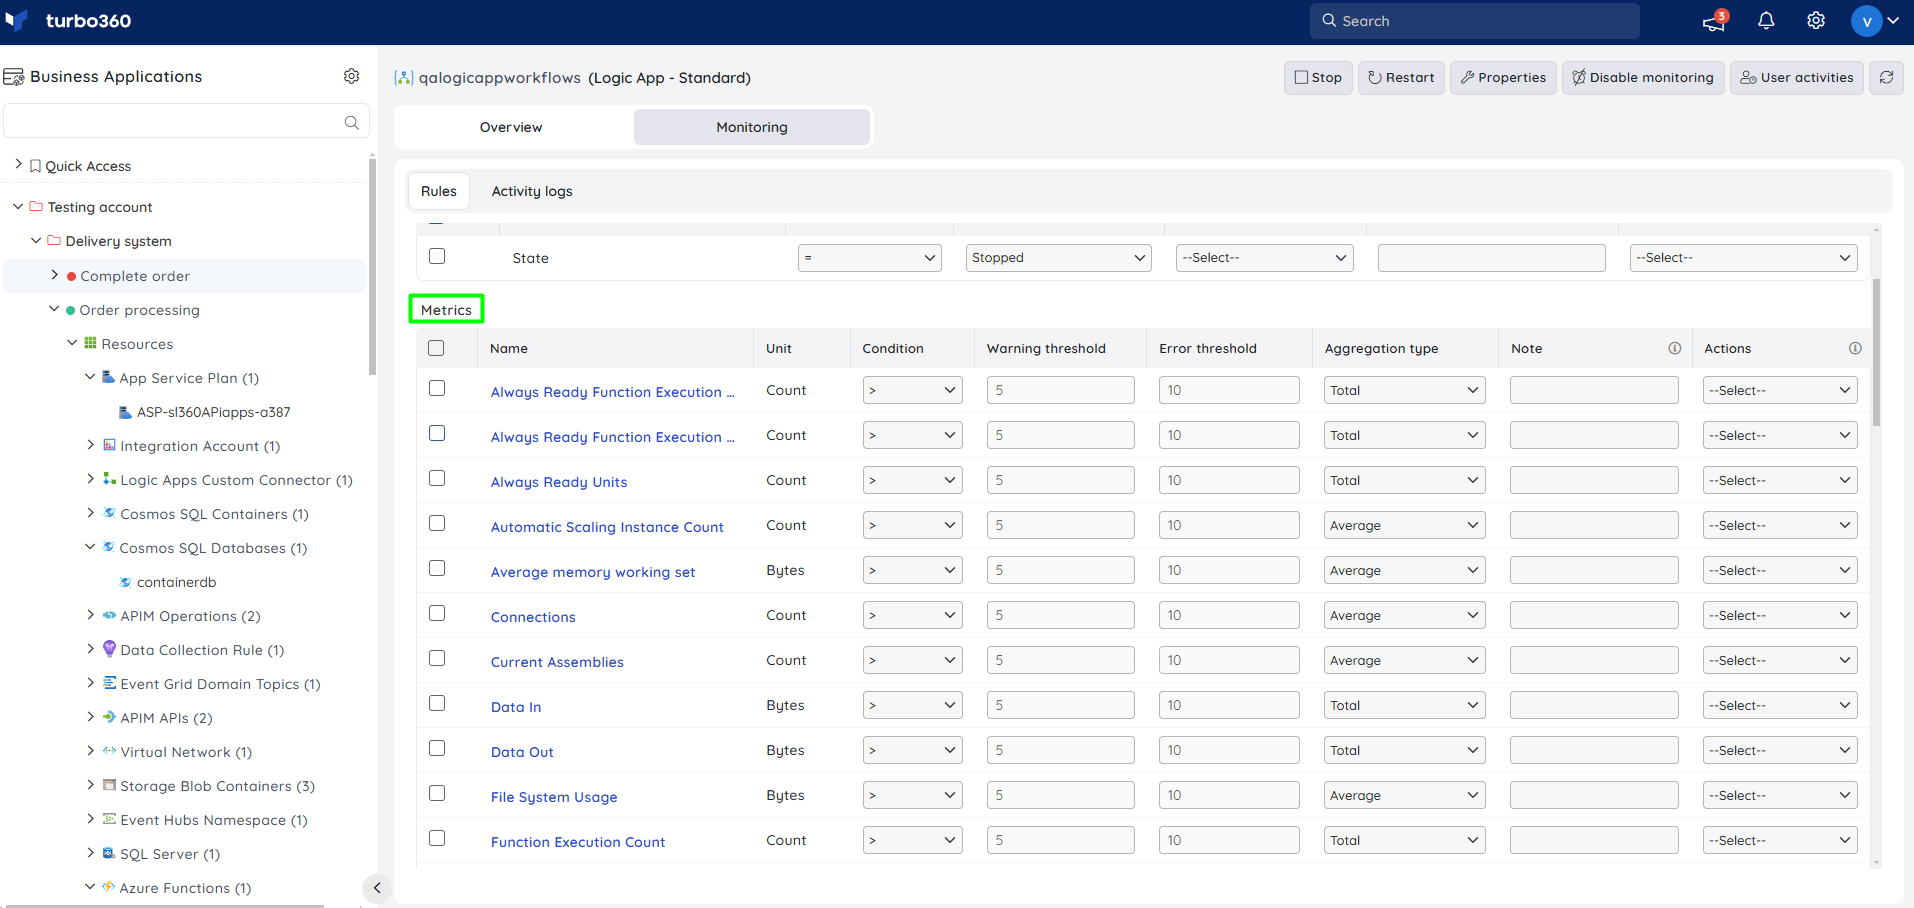
Metric monitoring
- Navigate to Logic App (Standard) -> Monitoring.
- Choose the required metrics and configure the threshold values.
- Click Save.
Monitoring recommendations
This section contains common monitoring scenarios for Logic App Standard. Remember that this is the app which hosts your workflows that we are monitoring here, and Turbo360 has features that can be configured separately for each workflow. You can also use App Insights in Turbo360 if you want to monitor specific queries for the Logic App telemetry.
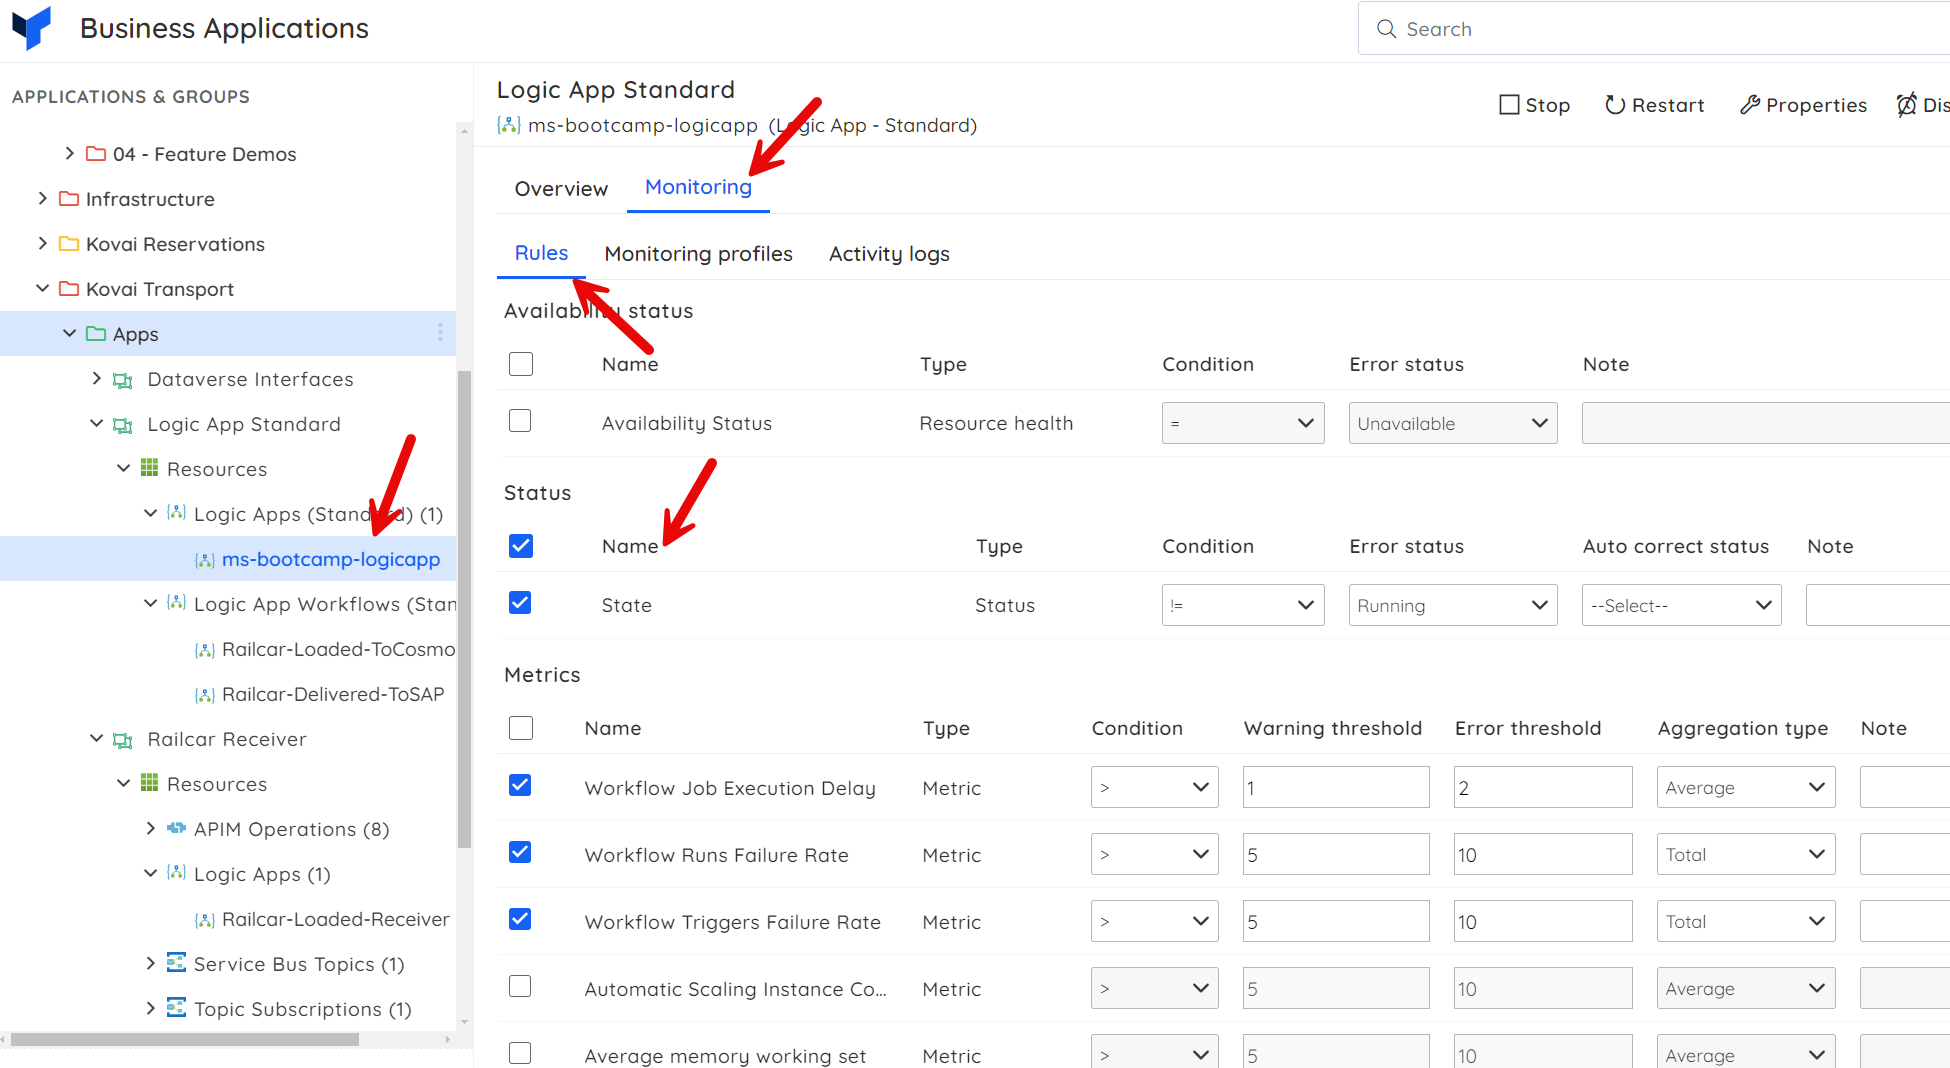
State — the picture below shows monitoring the app and raising an alert if it is not in the running state.
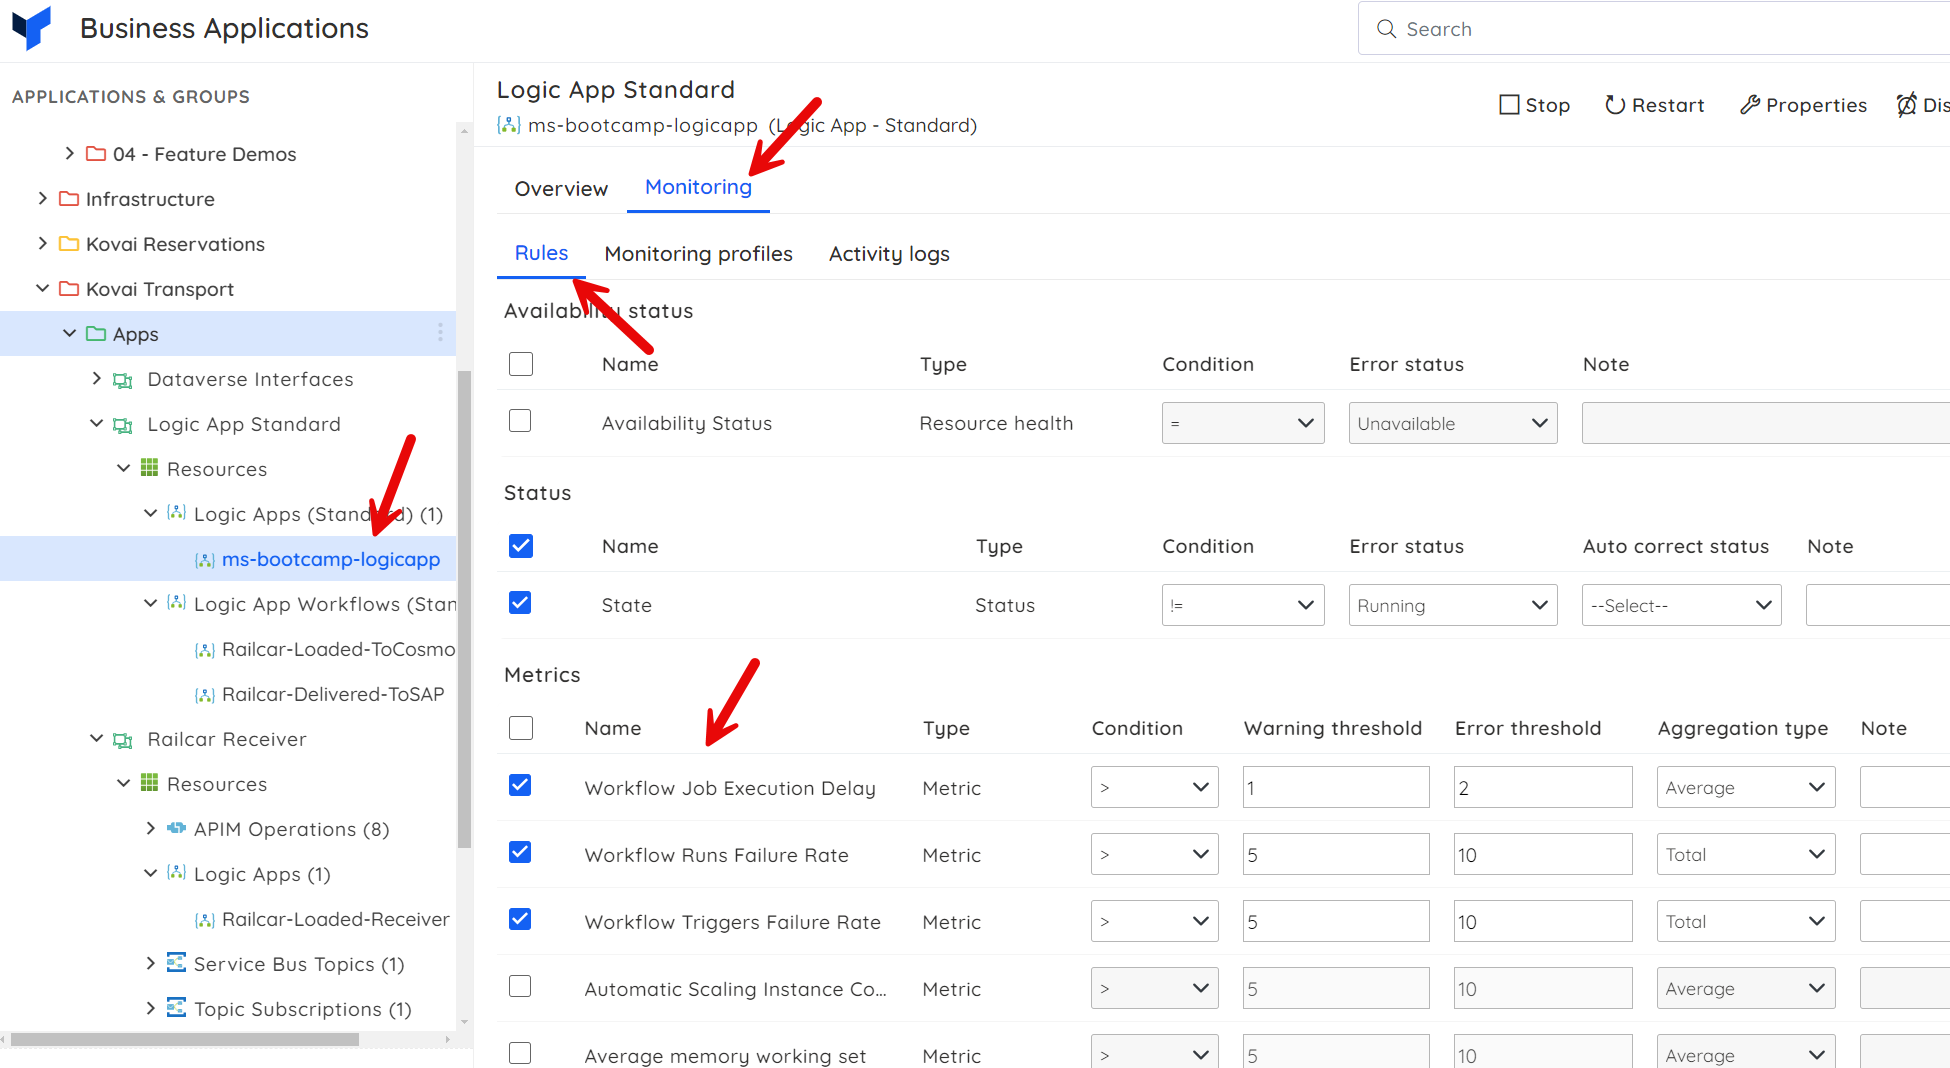
Metrics — below, we are monitoring some of the workflow runtime counters. Note that Logic Apps run on top of Functions, so there may be other function counters you may also wish to monitor. The counters below look at performance and failure rates across all workflows in this function app, so be aware that subtle differences in the expected behaviour of individual workflows may affect your monitoring here.
Some of the other counters you may wish to monitor:
| Metric | Warning Threshold | Error threshold |
|---|---|---|
| Connections | Varies | Varies |
| Http 4xx | Varies | Varies |
| Http Server Errors | Varies | Varies |
| Response Time | Varies | Varies |
| Private Bytes | Varies | Varies |
There are a number of factors that affect these counters that will vary based on the plan you choose to host the Logic App on, and also things like the number of apps on the plan and what those apps do.
A couple of key points to note for Logic Apps: you can also monitor the plan that hosts your Logic App, and you can also monitor individual workflows within the Logic App.
Troubleshooting
- Start, Stop, or Restart operation fails
Cause: The app is in a transitional state, or the role lacks the Manage permission.
Fix: Wait for the current state transition to complete, or confirm the role has Manage access, then retry. - State monitoring rule does not auto-correct
Cause: No auto-correct status was configured on the rule.
Fix: Edit the rule and specify an auto-correct status. - Metric monitoring rule fires unexpectedly
Cause: The threshold reflects aggregate performance across all workflows on the app, masking the behavior of a single workflow.
Fix: Configure monitoring on the specific workflow under Logic App Workflow (Standard) instead of, or in addition to, the app-level rule. - Dashboard widgets show no data
Cause: The app was recently associated and has not completed its first monitoring cycle.
Fix: Wait for the next monitoring cycle, then refresh the dashboard.
Related articles
Was this article helpful?