

Managing analysis views
- 09 Aug 2026
- 6 Minutes to read
- Print
- DarkLight
- Download PDF
Managing analysis views
- Updated on 09 Aug 2026
- 6 Minutes to read
- Print
- DarkLight
- Download PDF
Article summary
Did you find this summary helpful?
Thank you for your feedback!
Overview
This article explains how to manage Analysis views—saved, filterable snapshots of cost data scoped to specific subscriptions. Because each view retains its filter configuration, you can quickly revisit it, set it as the default view, create a copy, or use it to create a monitor, comparison, task, or scheduled export without redefining the filters.
Business value
Analysis views let you define a filtered cost perspective once and reuse it across monitors, comparisons, tasks, and scheduled exports — without rebuilding filters each time. Teams that track recurring cost patterns across subscriptions can pin views as defaults, automate data delivery on a schedule, and escalate spend anomalies directly from the same view, keeping cost governance consistent and reducing the overhead of manual, repetitive analysis.
Prerequisites
A Cost management group with imported cost data must exist before you can add or manage Analysis views.
How it works
- Each analysis view displays subscription costs filtered to the criteria you apply.
- Views can be saved, pinned as defaults, cloned, or deleted independently.
- A view can be promoted into a Cost monitor, inheriting its filters as monitoring rules.
- Views also serve as the basis for cost comparisons, inline tasks, and scheduled exports.
Cost comparison
Azure subscription costs for two different time ranges can be compared by selecting Compare from the Actions menu within an analysis view.
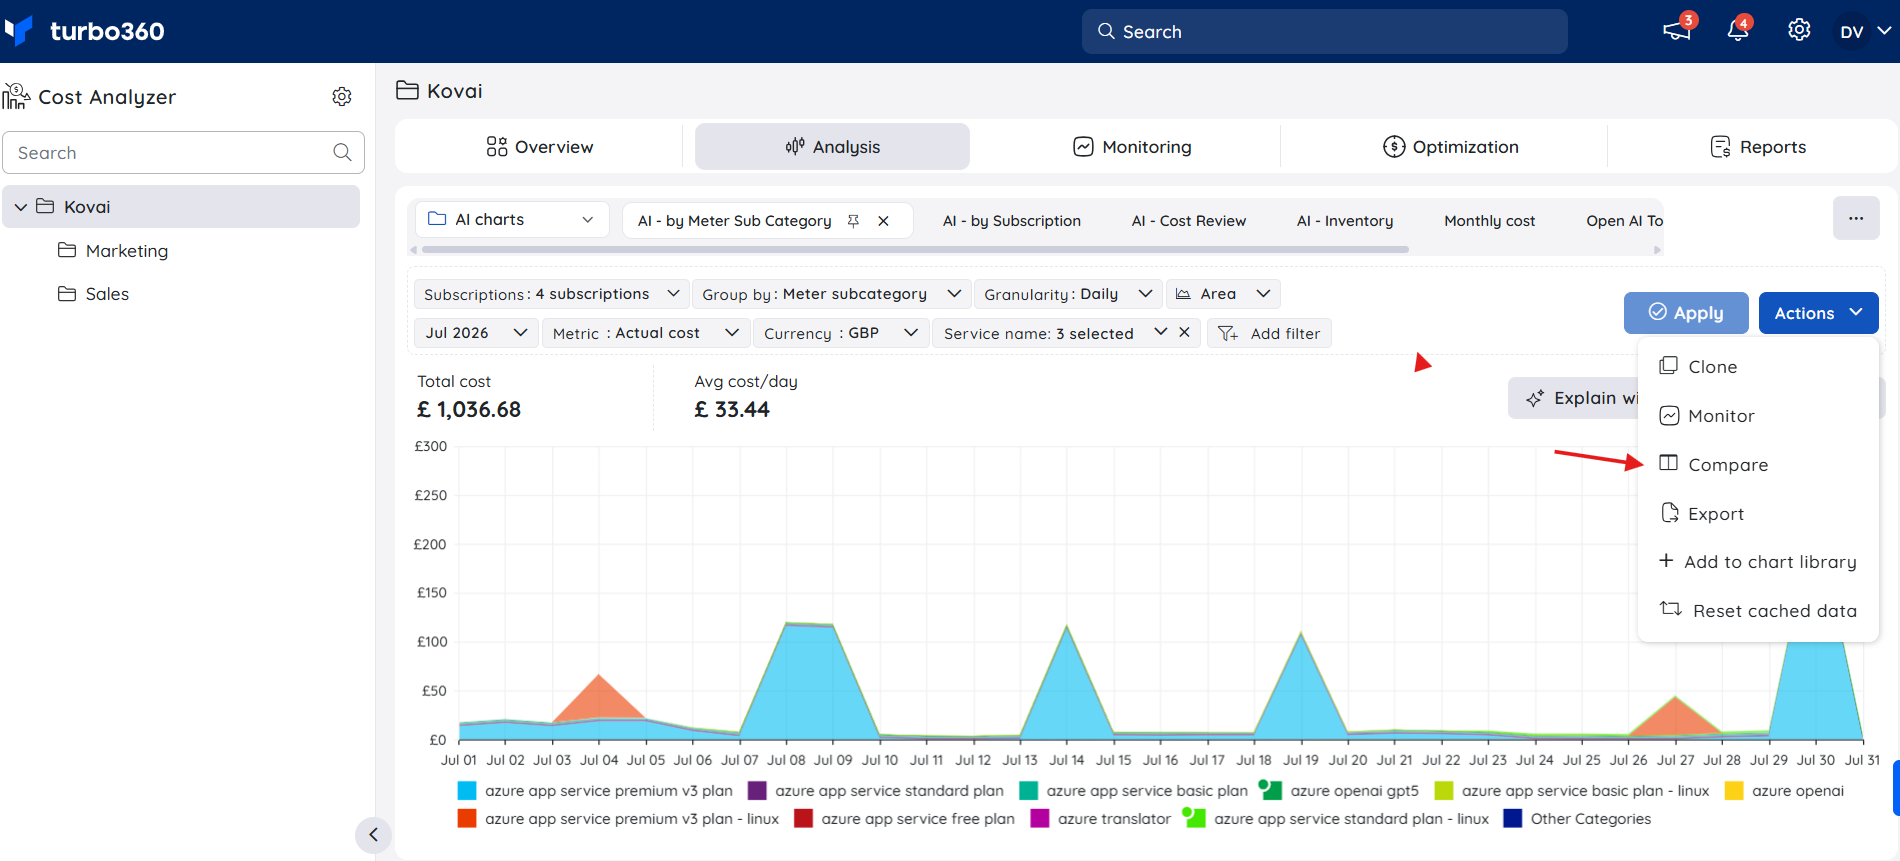
Customize the filters and time ranges to view cost comparison for the selected subscriptions.
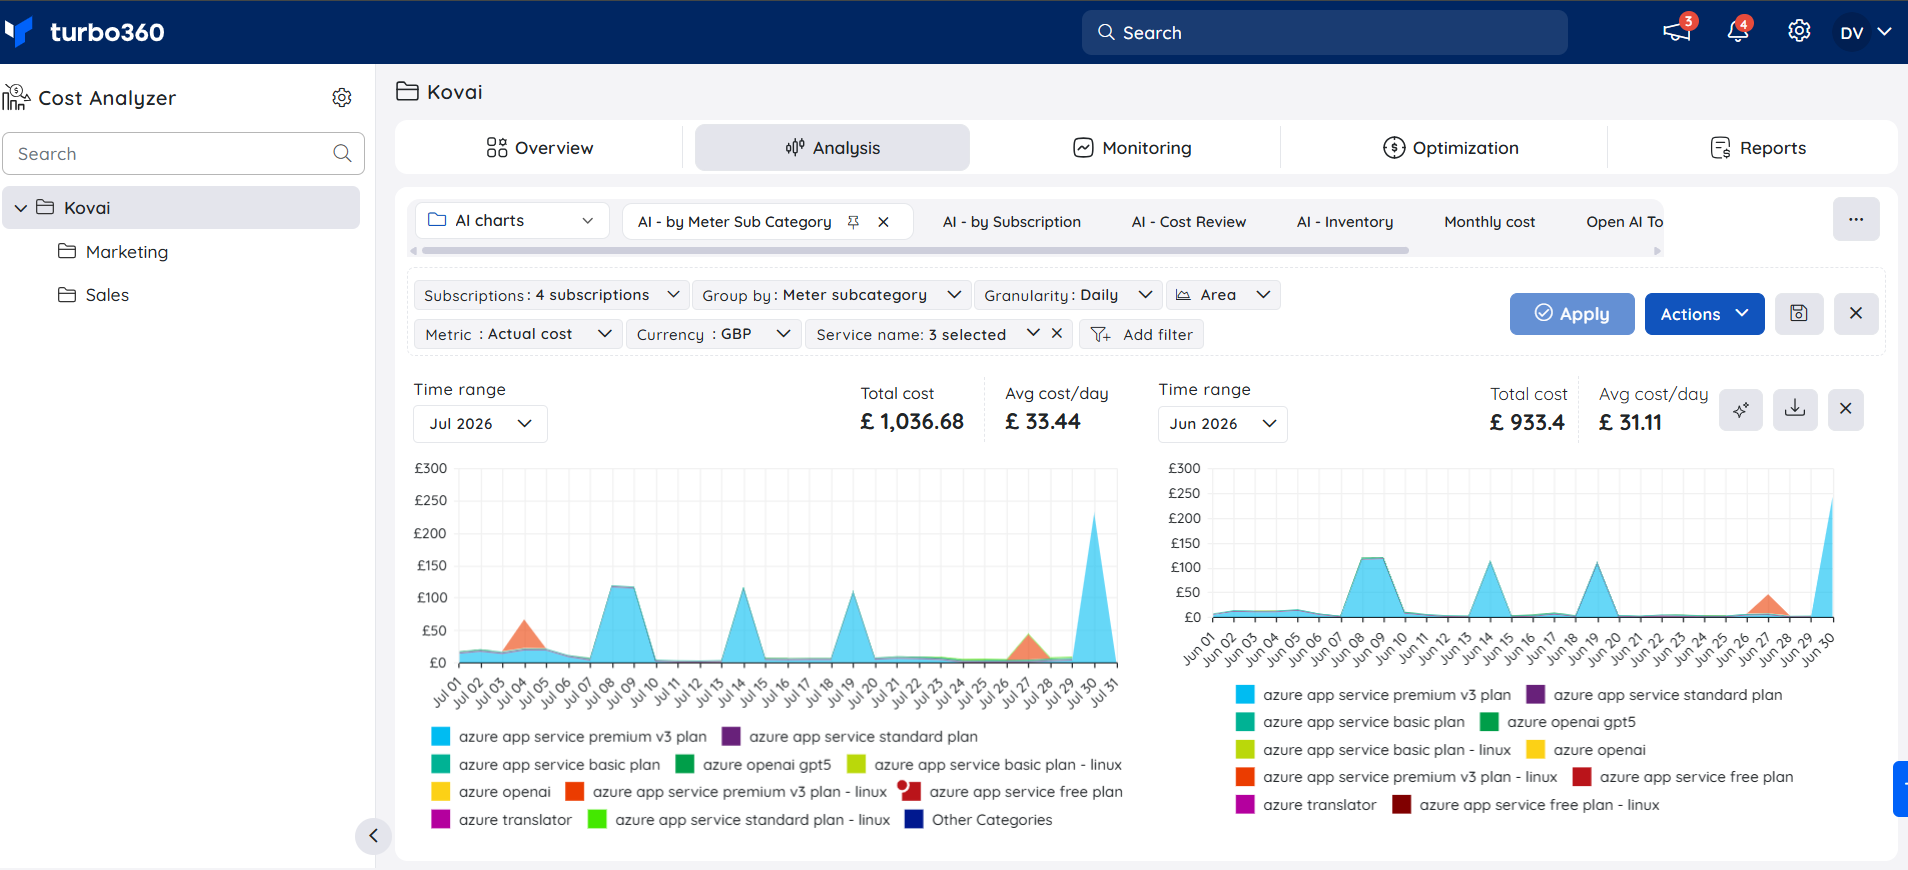
The Table chart offers two capabilities unavailable in other chart types:
- It shows the cost difference between two time ranges for individual subscriptions.
- Time ranges can be swapped — a capability exclusive to the Table chart.
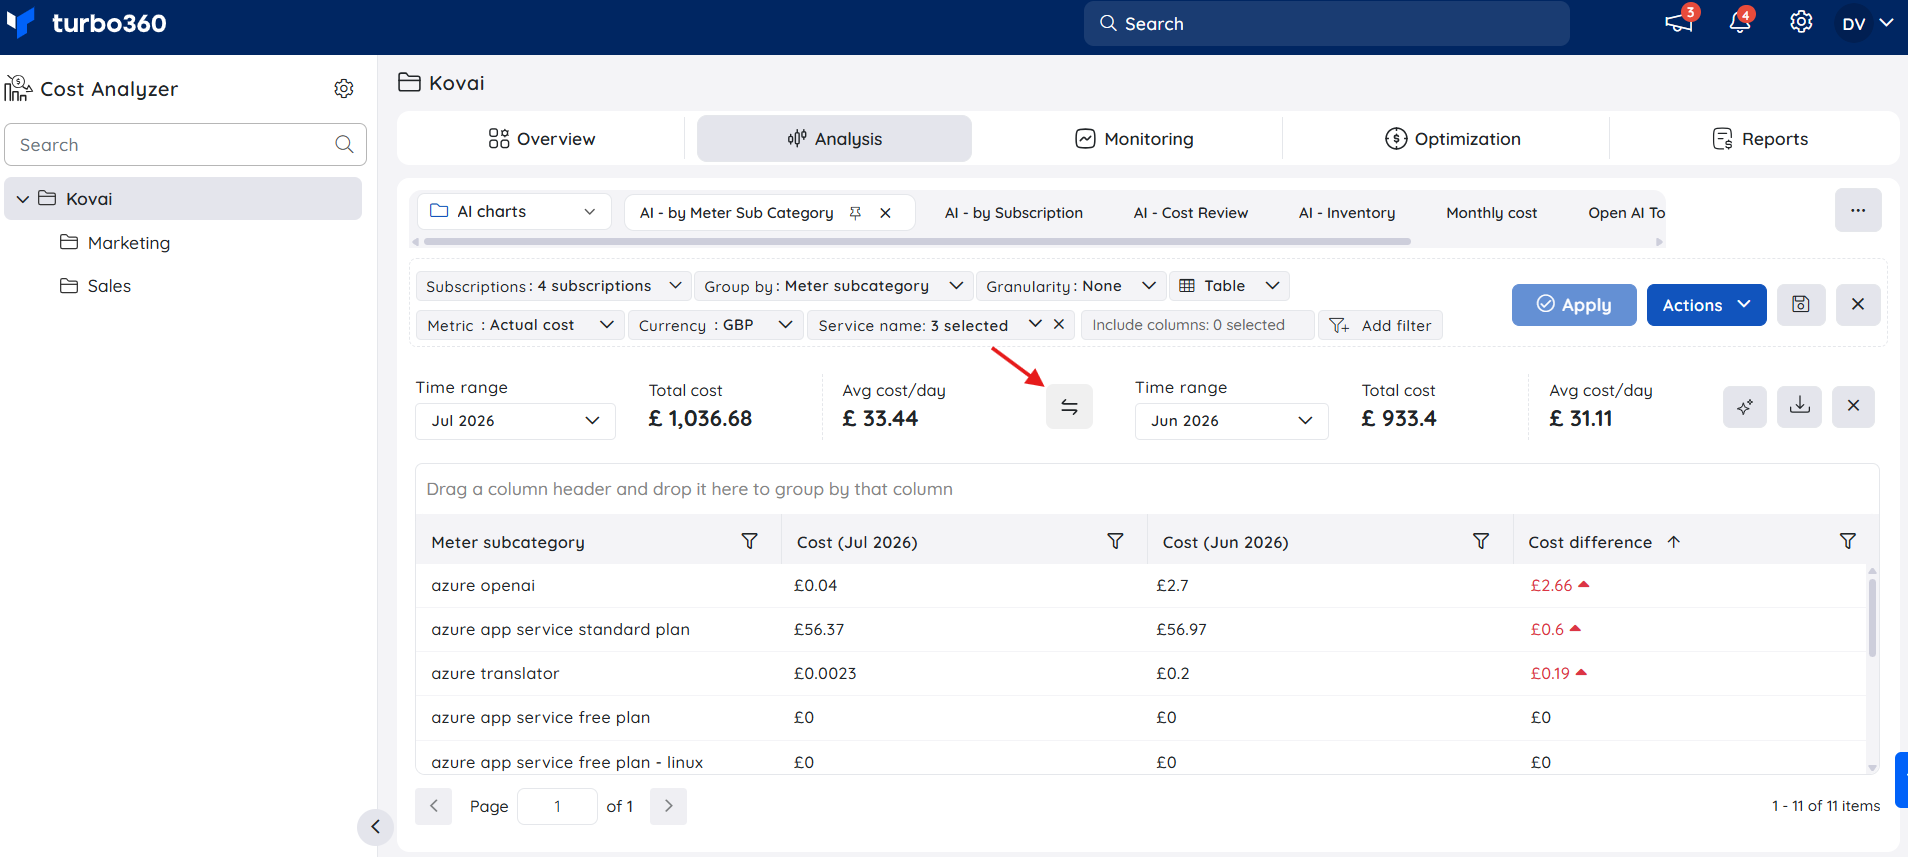
The Table chart supports the Compare option only when Granularity is set to None.
Collections
Collections let you group Analysis views into named containers, so you can organize views by team, project, or use case instead of managing every saved view in a single flat list.
How it works
- When a Cost management group is created, a default collection is set up automatically and pre-populated with a set of default views.
- The active collection and its view count are shown in the collection selector at the top of the Analysis section.
- Beyond the default collection, you can create your own collections and save new views into whichever collection is active at the time.
- One collection can be marked as Default — it opens automatically when you enter the Analysis section.
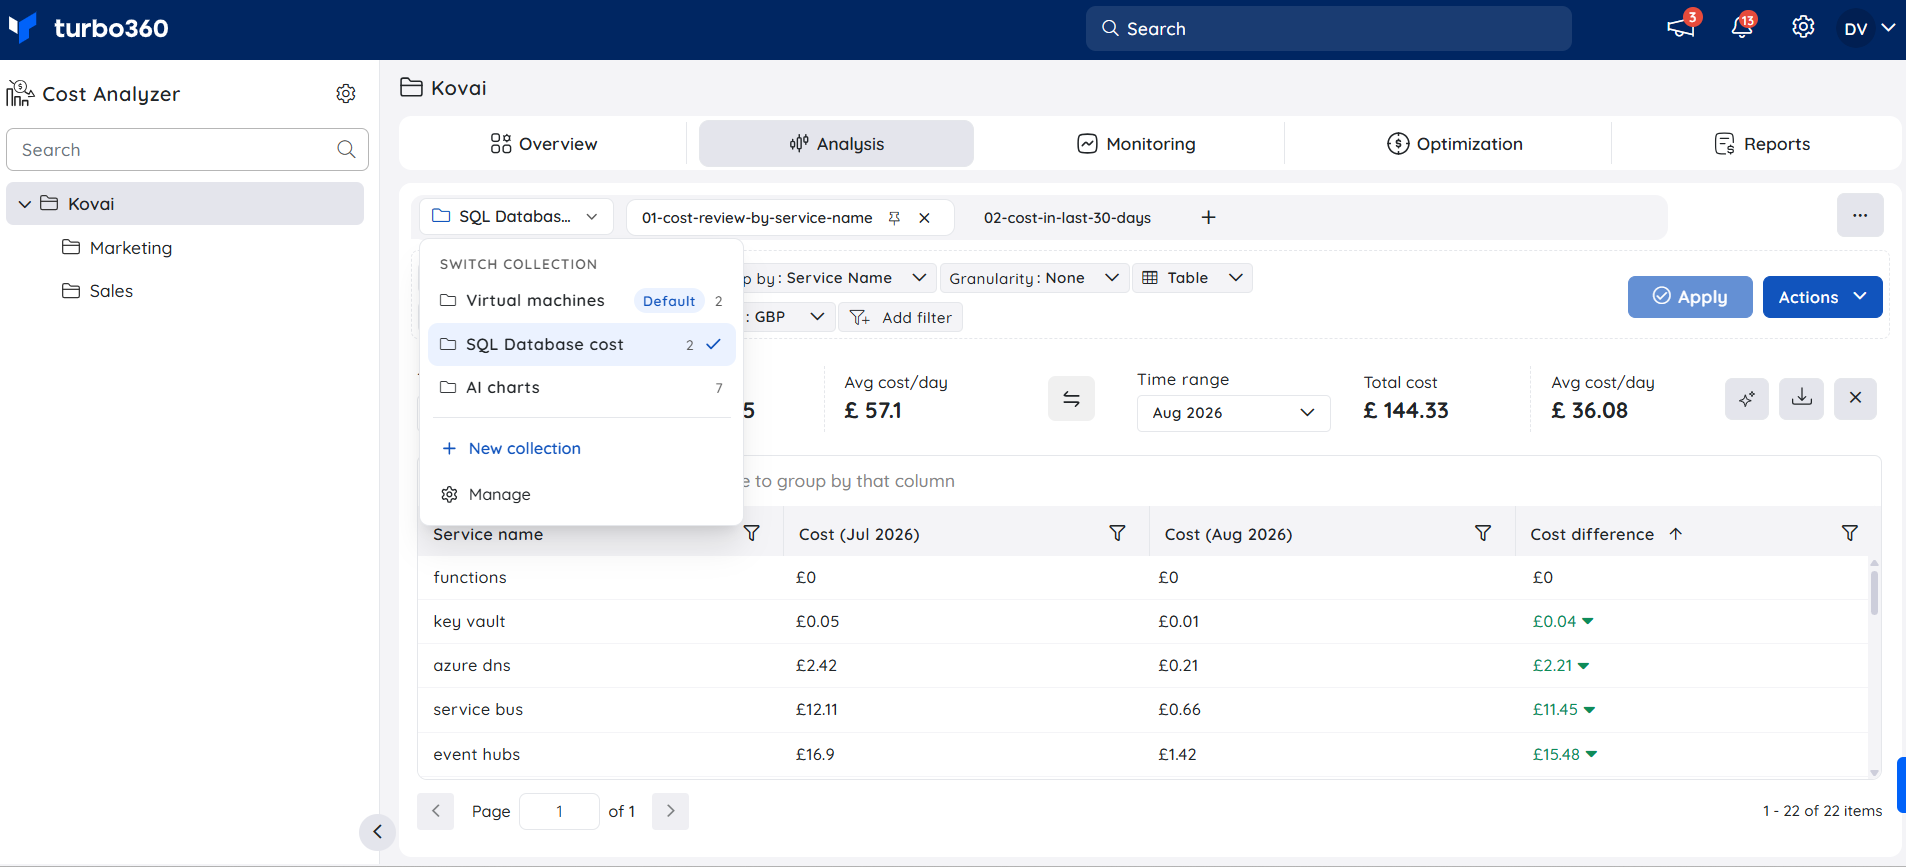
Switch between collections
Switching collections changes which set of saved views appears as tabs in the Analysis section.
- Click the collection selector at the top of the Analysis section.
- Select a collection from the Switch collection list.
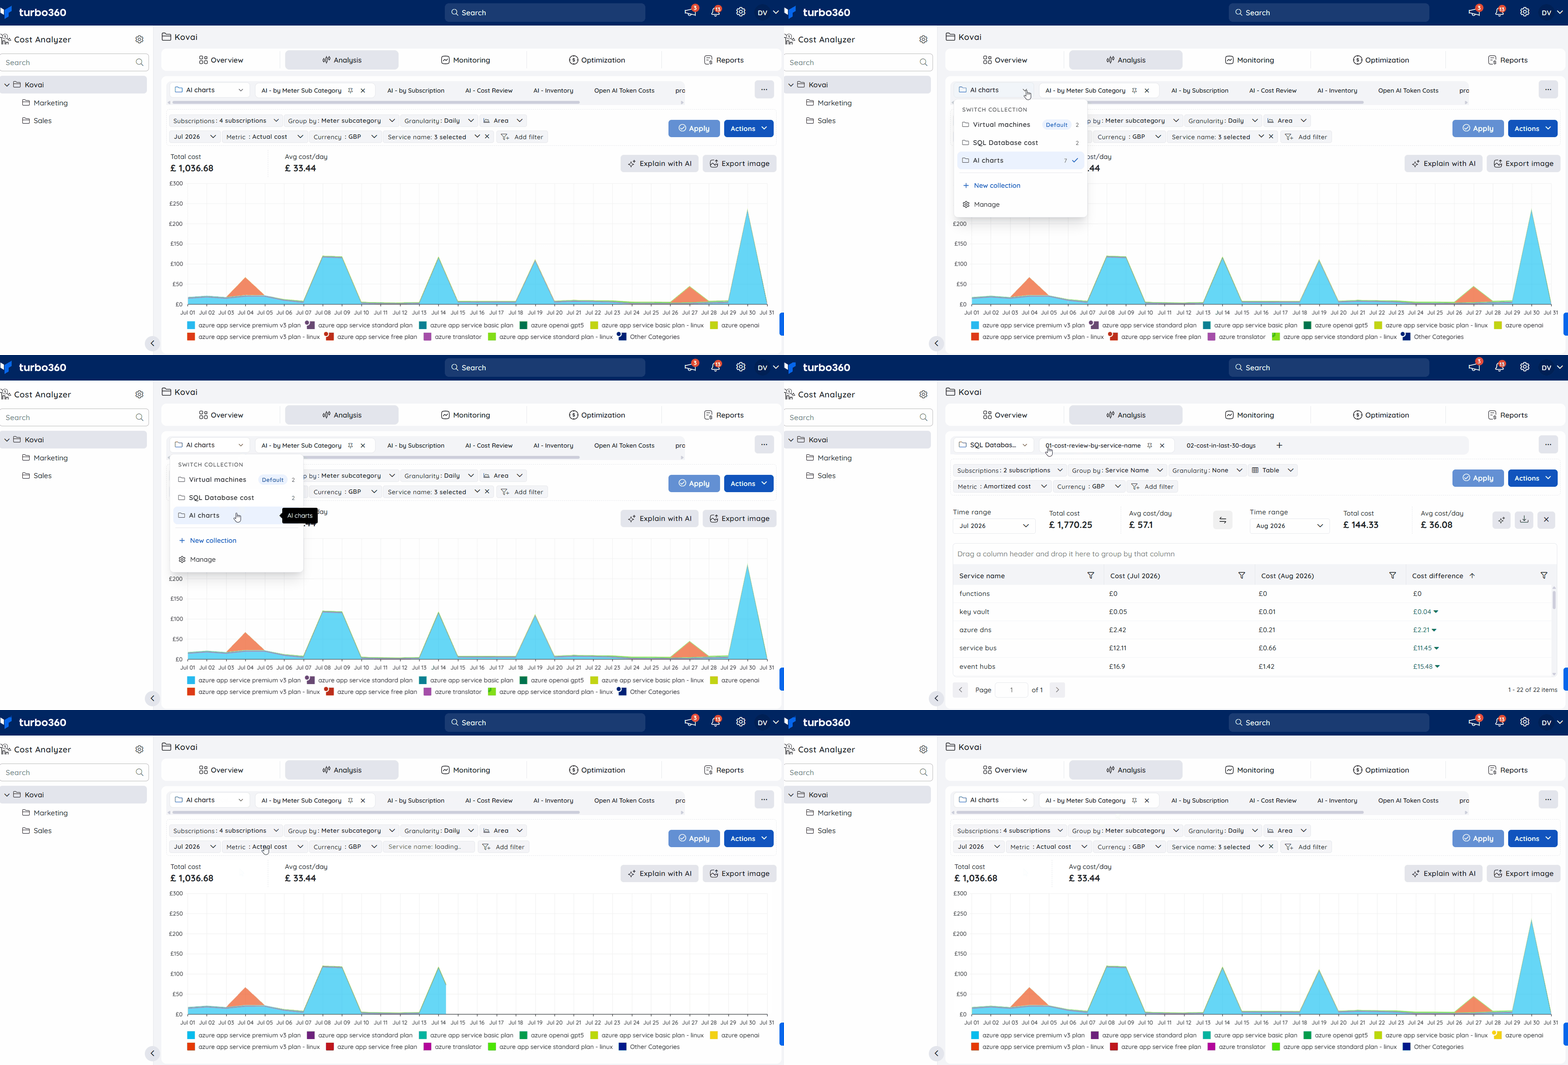
Create a collection
Creating a collection gives you a new, empty container for a fresh set of views.
- Click the collection selector, then click + New collection.
- Enter a name for the collection.
- Click the check mark to confirm, or the X to cancel.
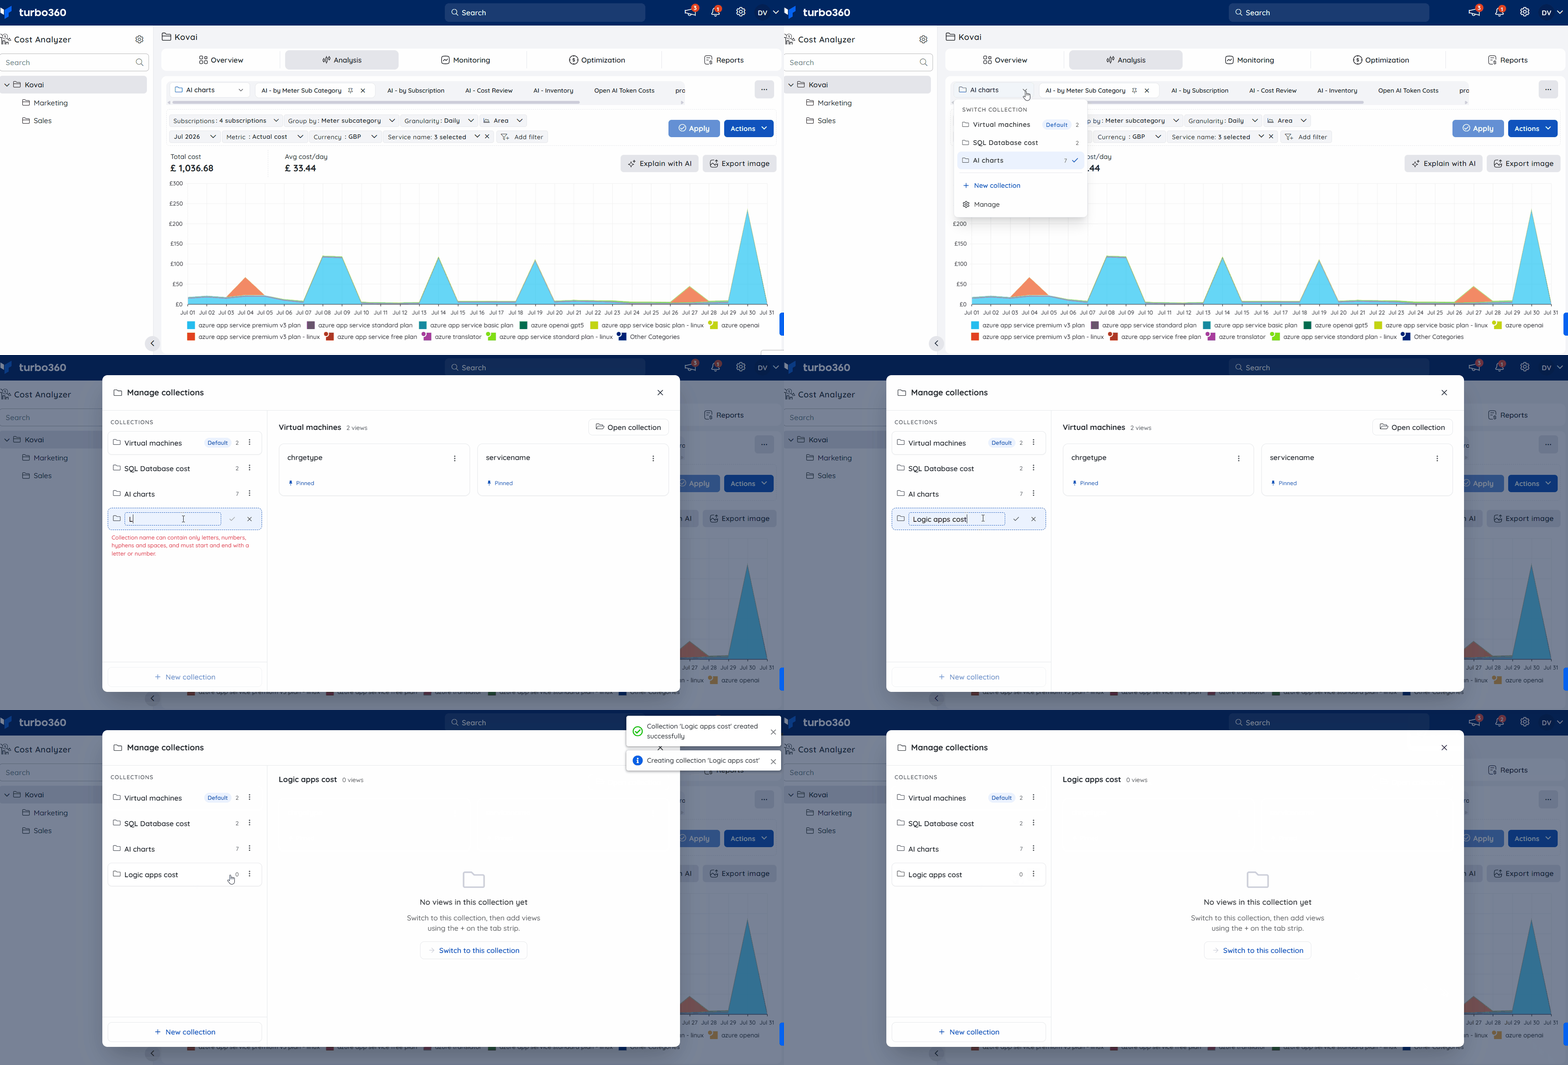
Manage collections
Managing collections lets you rename, clone, set a default, or delete a collection, and review the views inside each one, from a single screen.
- Click the collection selector, then click Manage.
- Select a collection from the list on the left to view its saved views on the right.
- Click the Context menu ( ⋮ ) next to a collection to Rename, Clone, Set as default, or Delete collection.
- Click Open collection to switch to that collection's tabs.
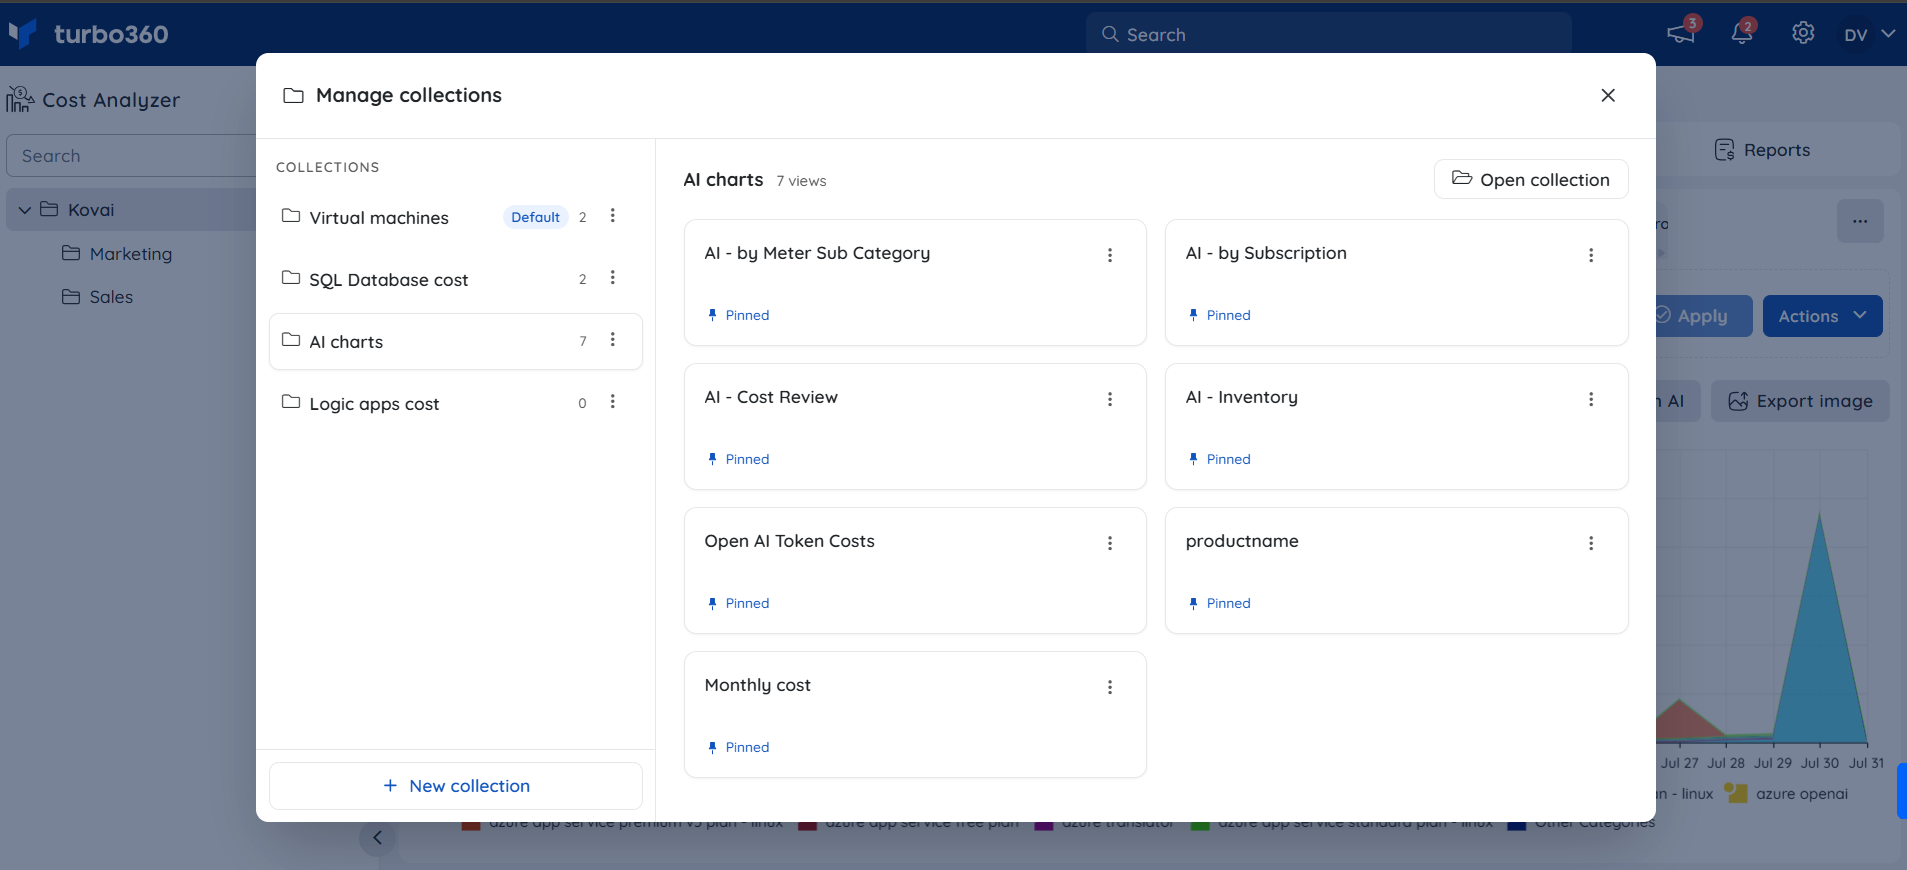
Each listed view within Manage collections also has its own Context menu ( ⋮ ), offering Rename, Clone, Pin / Unpin from tab strip, and Delete — the same actions available from the view's tab in the Analysis section.
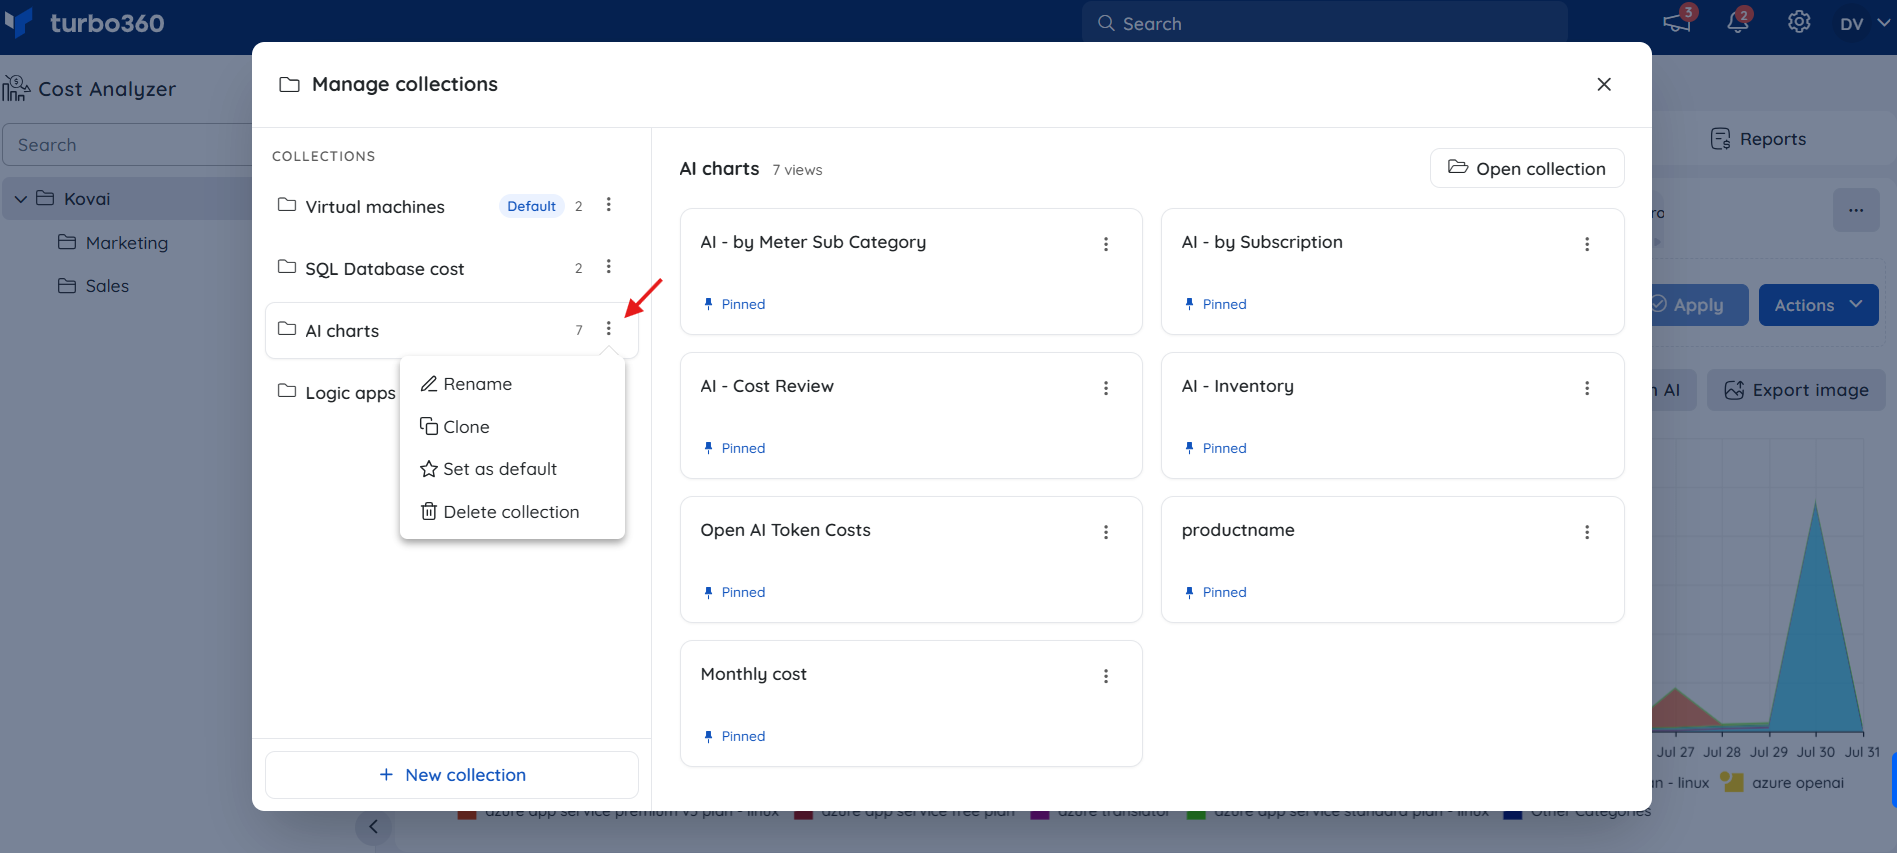
Deleting a collection removes all views saved within it. This action can't be undone.
Steps
Use the following steps to add, save, clone, and delete analysis views within a Cost management group. Open the Analysis section of the relevant group to get started.
Add an analysis view
Adding a view opens a new filterable cost perspective scoped to the subscriptions and filters you choose.
- Click the + icon in the Analysis section of a Cost management group to add a new view to the currently active collection.
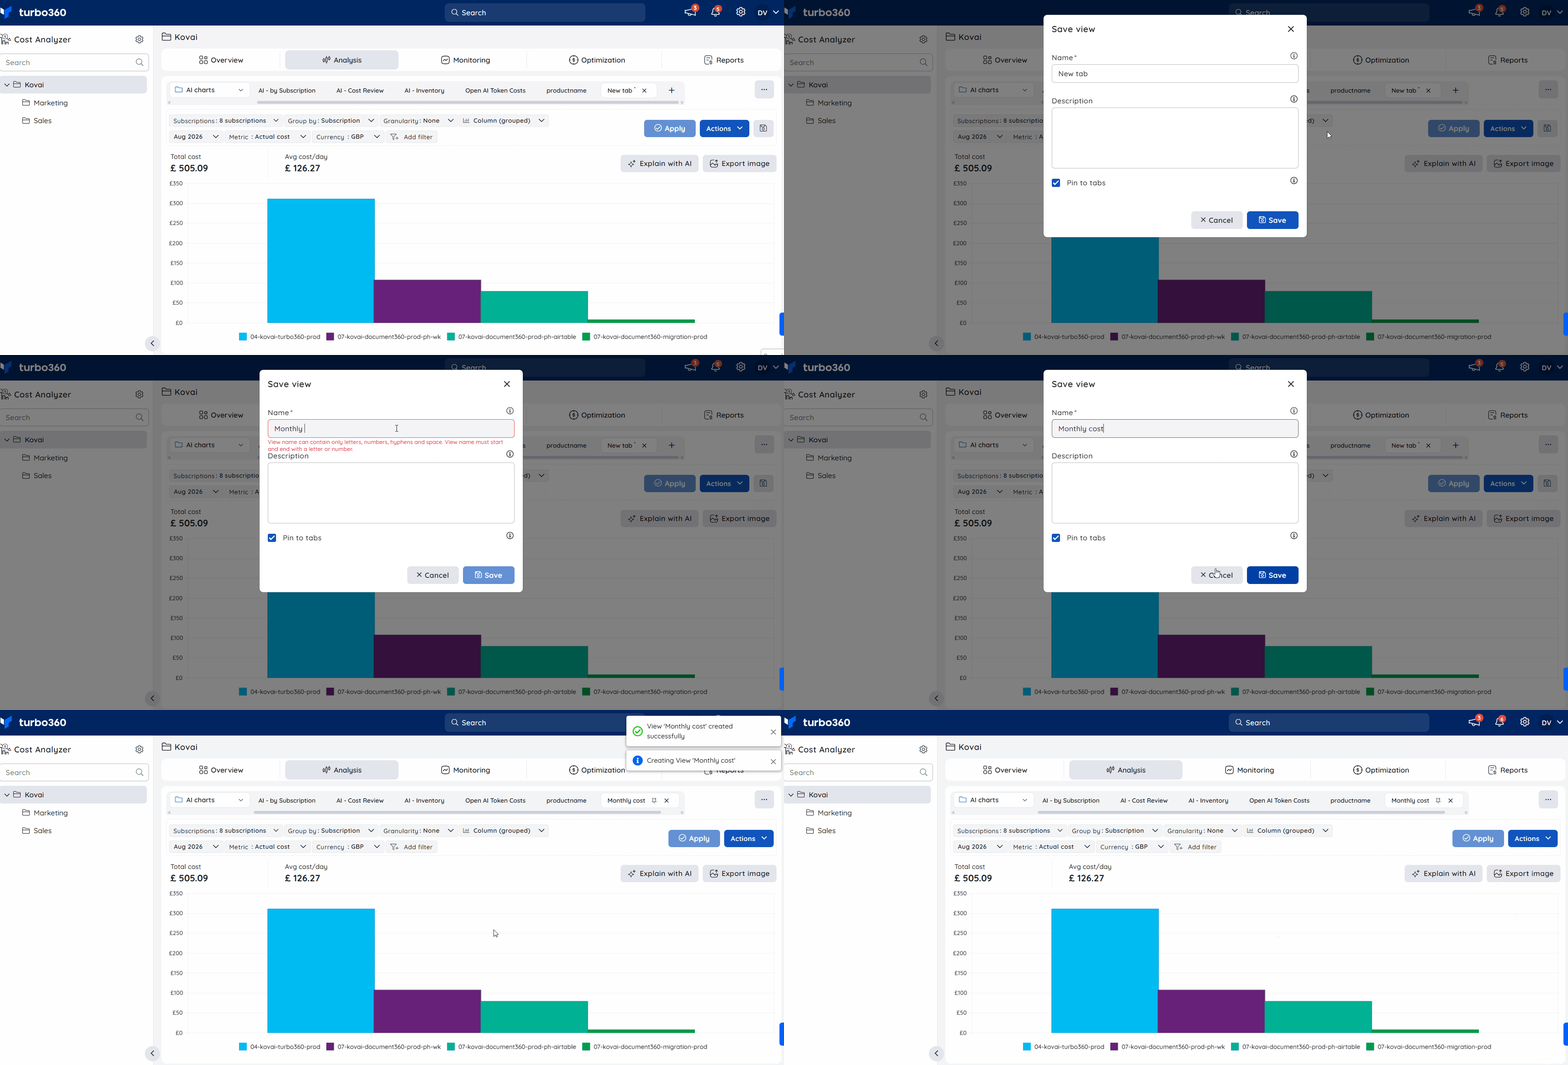
Save an analysis view
Saving a view stores its filter configuration so you can reuse it across monitors, comparisons, tasks, and scheduled exports without rebuilding filters each time.
- Click Save in any view to save it for future use.
- Enter a name for the view and a description, if required.
- Select Pin to tabs to make this one of the default views in the Analysis section.
- Click Save.
Saved views are accessible from Manage collections, which lets you update, pin or unpin, open, and delete views within their collection.
Views are always saved into whichever collection is active at the time — switch collections first if the view belongs elsewhere. See Collections.
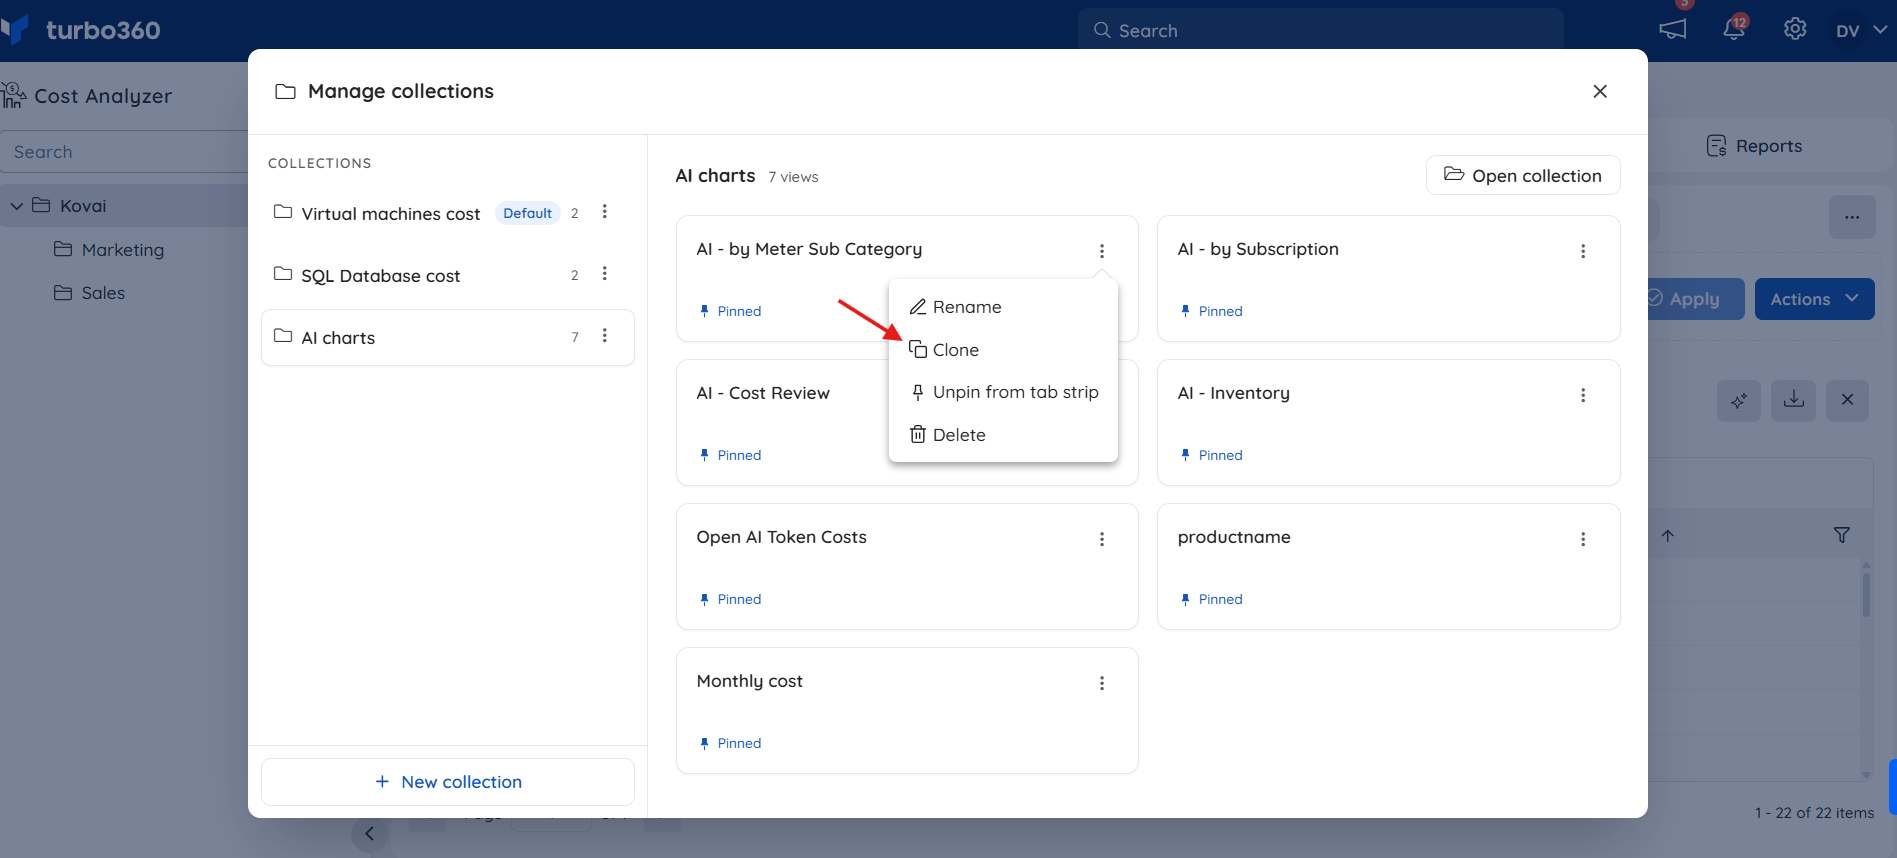
Clone an analysis view
Cloning creates a copy of an existing view, preserving its filters as a starting point for a new perspective.
- Click Actions dropdown -> Clone in an analysis view to clone it.
.png)
(or)
- Click the Clone icon in a Saved view.
- Enter a name for the cloned view.
- Select Pin to tabs if the view should display by default.
- Click Clone.
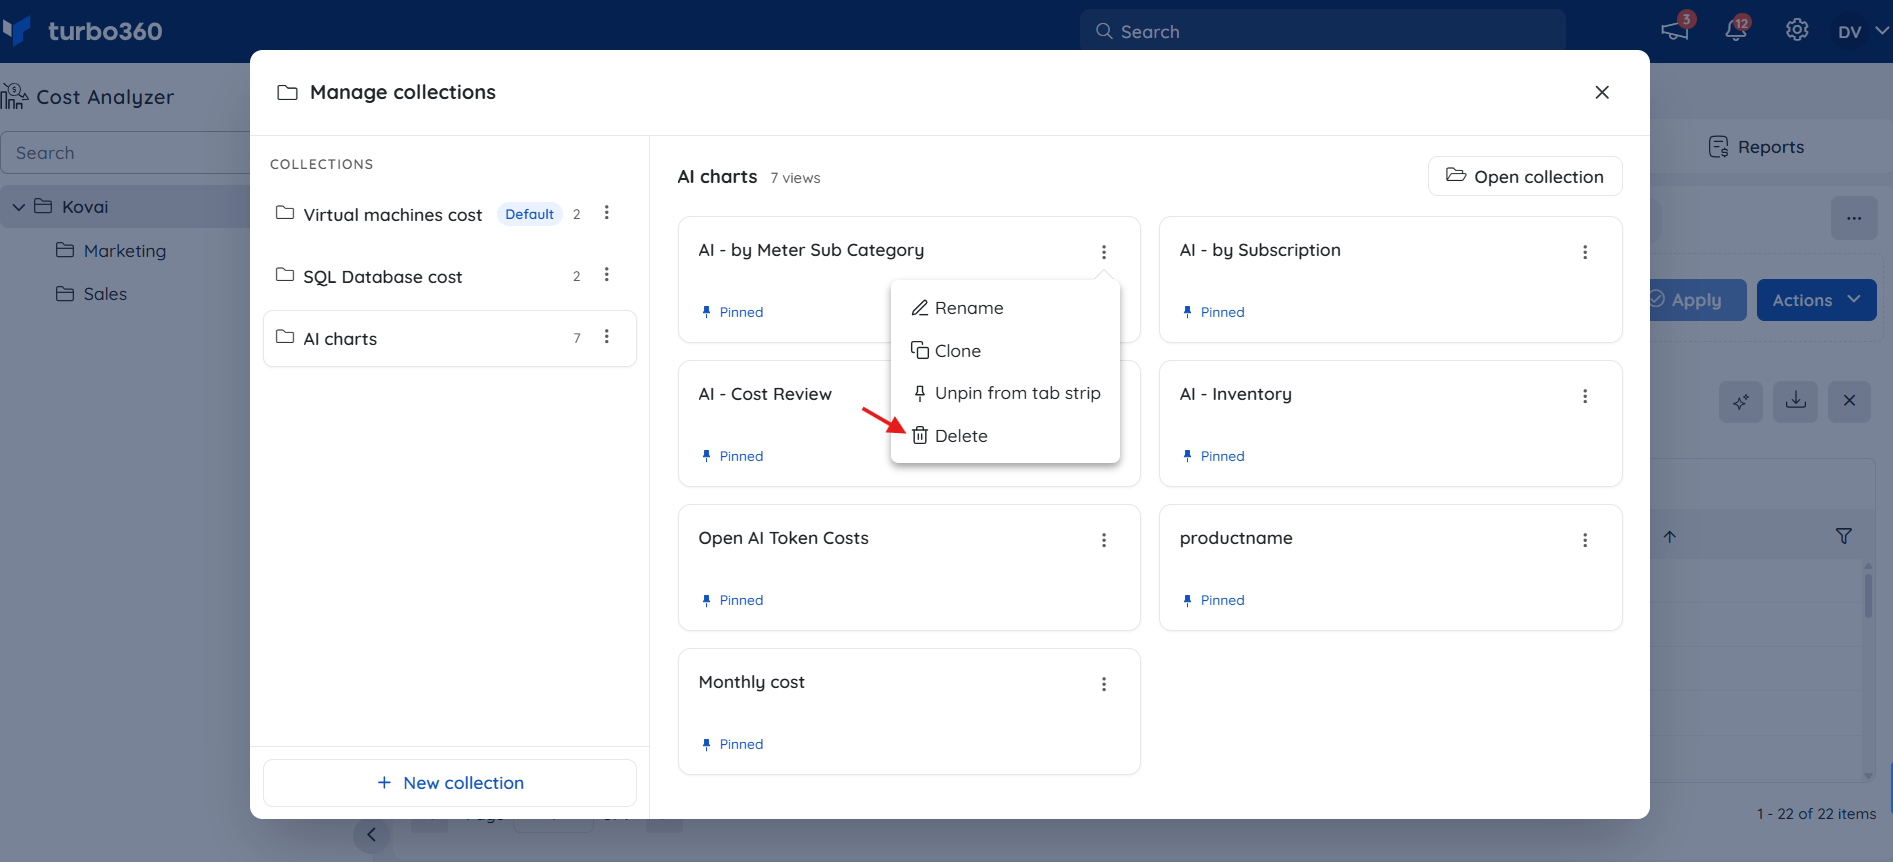
Delete saved analysis views
Deleting a saved view permanently removes it from the Analysis section and from its collection.
- Click the collection selector, then click Manage.
- Select the collection containing the view.
- Click the Context menu ( ⋮ ) next to the view and select Delete.
- Click Delete in the confirmation box.
Closing a view from the View tab does not delete it — it only closes the tab. The view remains accessible from Manage collections.
Cost monitors from analysis views
- Cost monitors can be created directly from an analysis view by selecting Monitor from the Actions menu dropdown.
- The monitor inherits the filters applied to the analysis view as its monitoring rules.
- Filter changes on the view are automatically synchronized with the associated monitor.
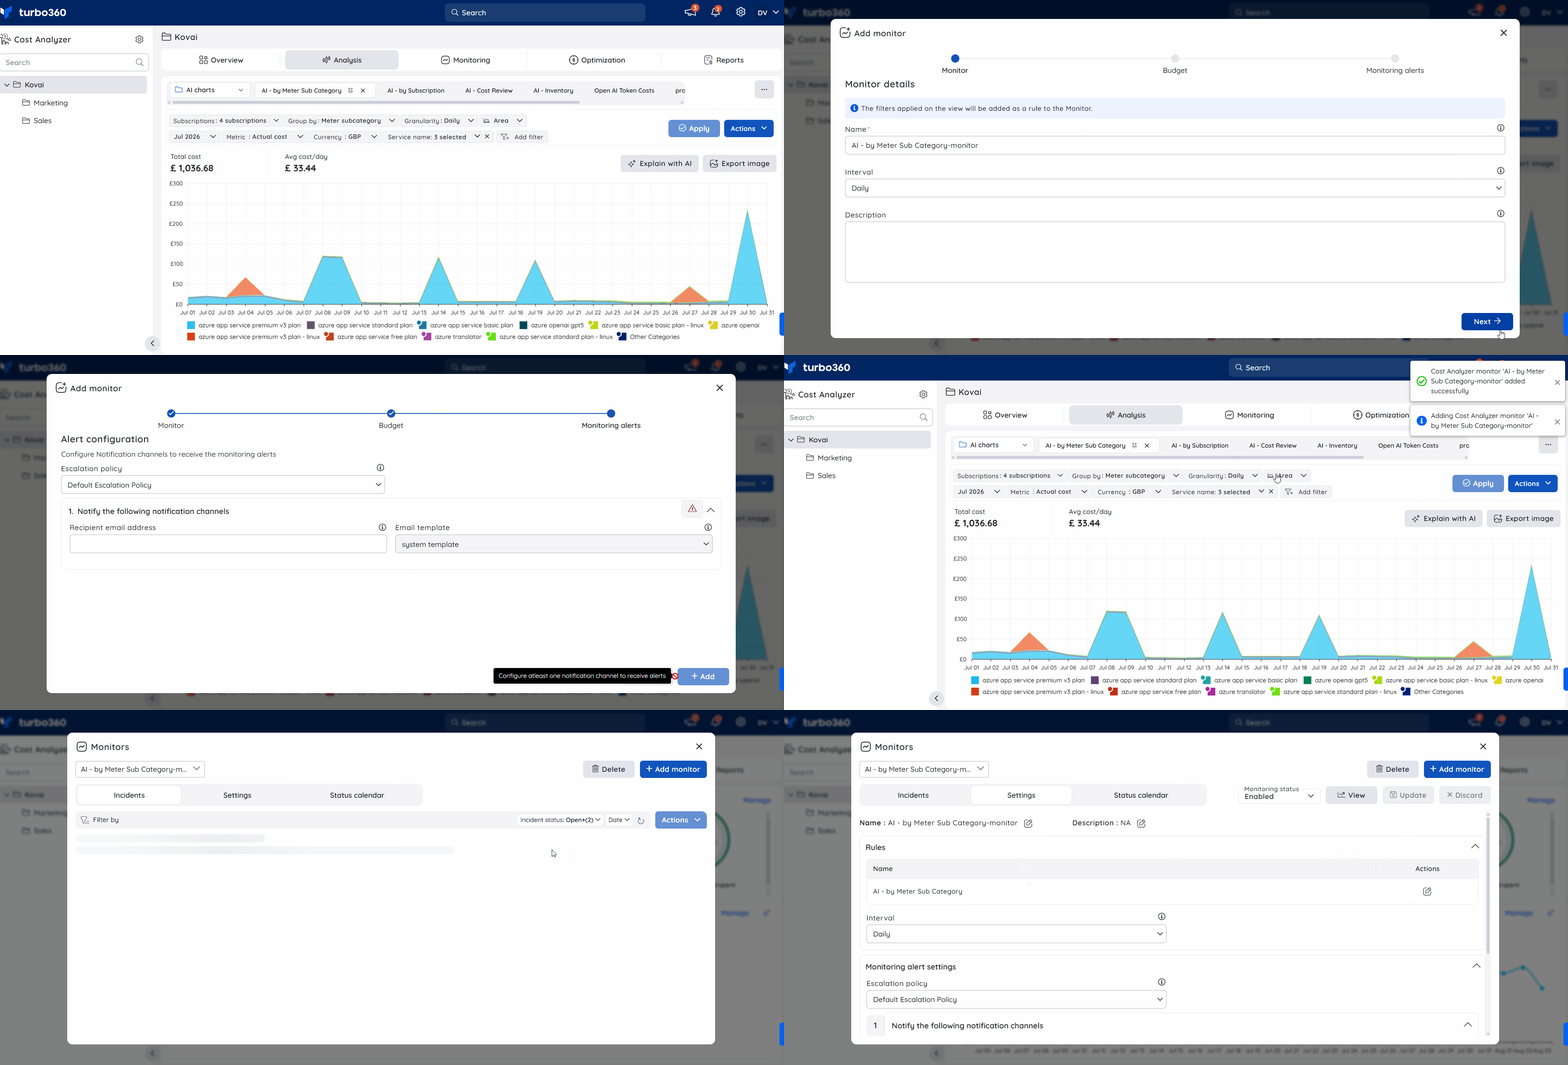
Within the monitor, you can view only the subscription and filters configured in the monitoring rule. Adding new subscriptions or modifying existing filters there isn't supported.
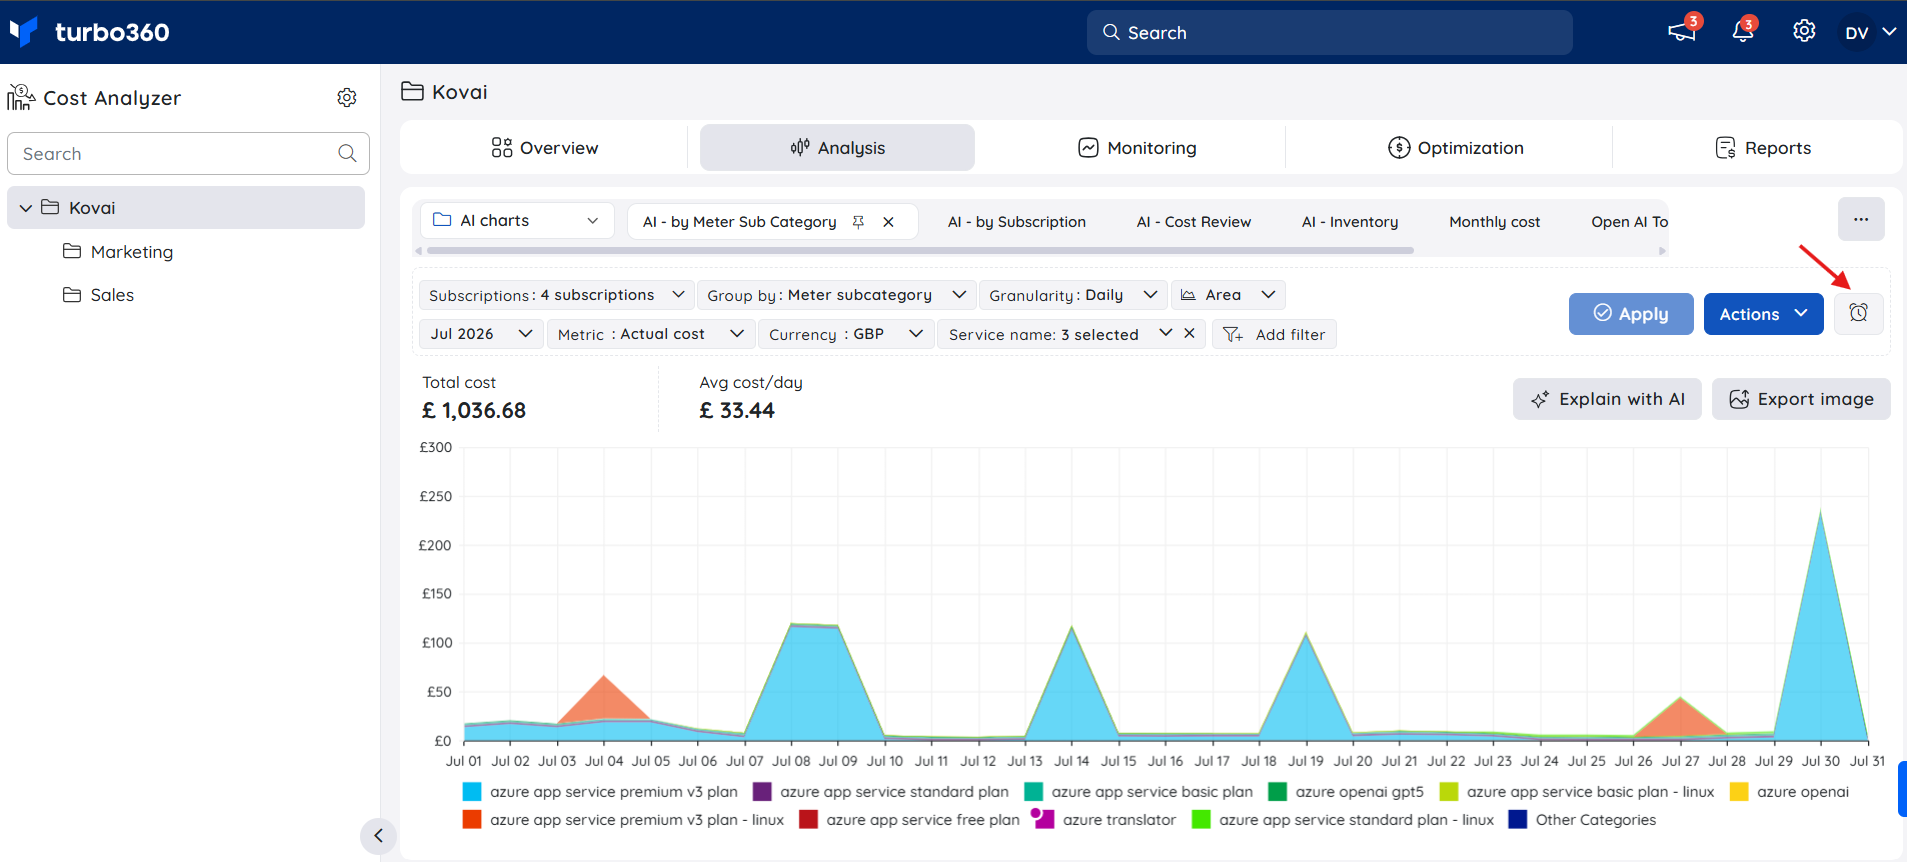
Views associated with a Cost monitor are indicated by an alarm icon.
Task creation from analysis views
Turbo360's Task planner, available through the profile drop-down menu, streamlines task scheduling, team assignments, and centralized oversight across the platform. Cost Analyzer's built-in Task management lets you create and manage tasks directly within the module — no need to monitor spend and review optimizations elsewhere.
- Navigate to the Analysis section of a cost management group.
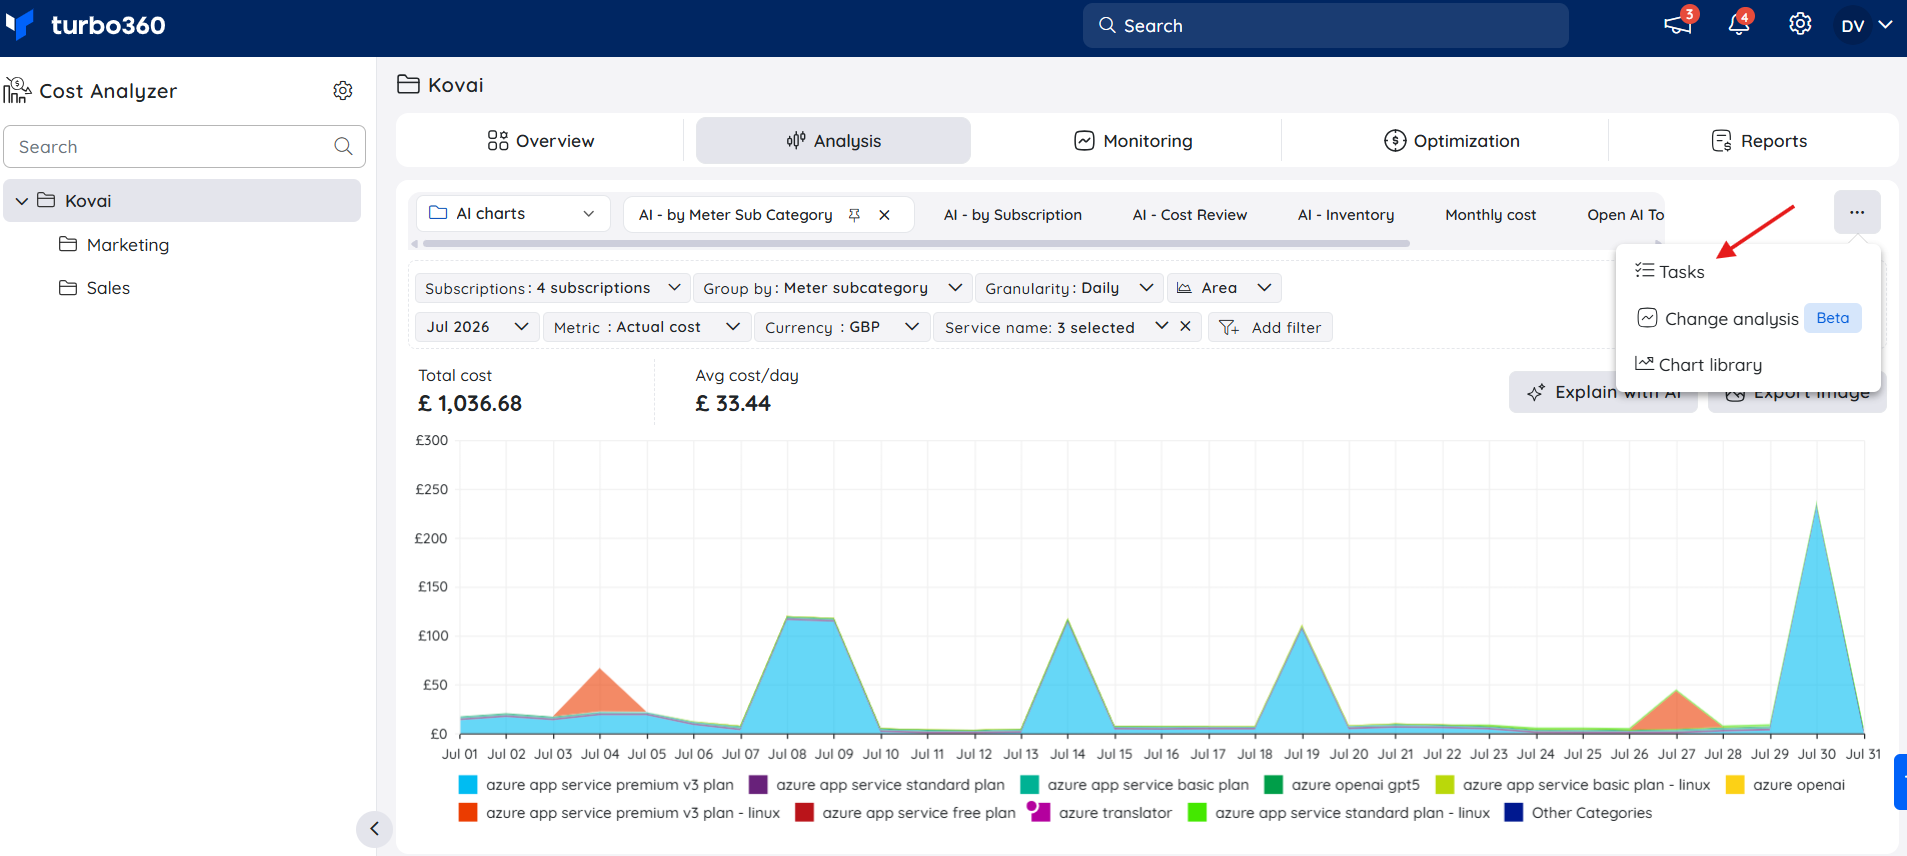
- Click the Context menu ( ⋮ ) and select Tasks.
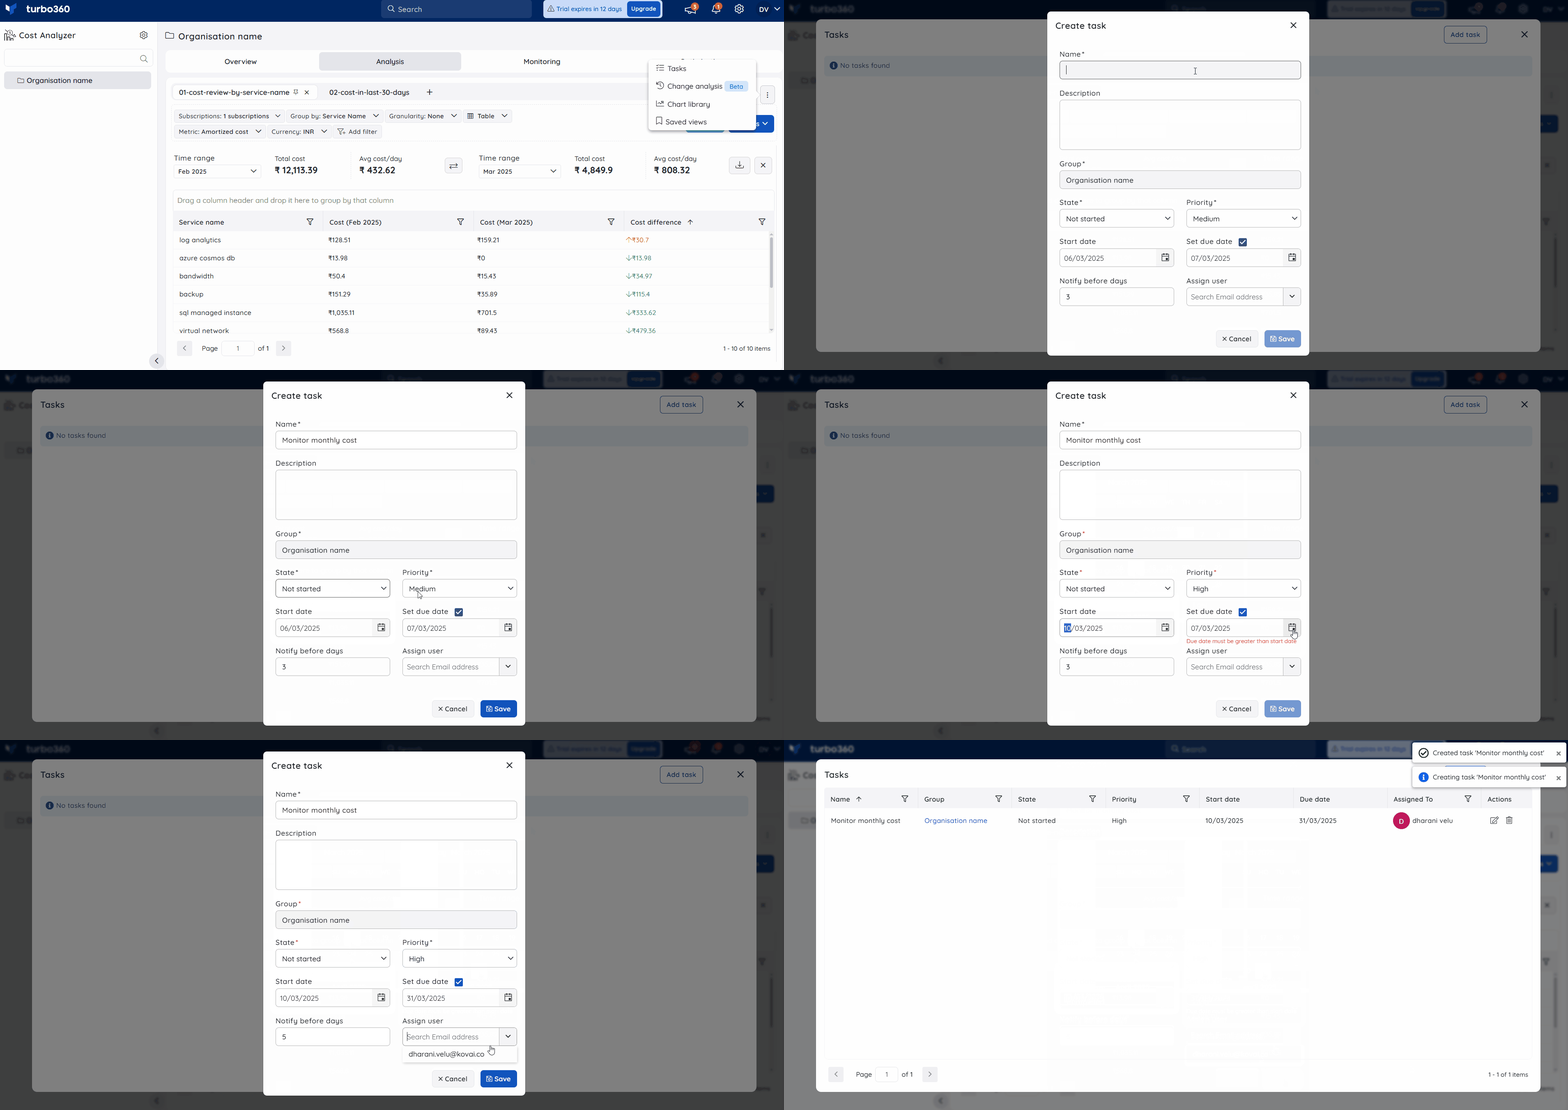
- Click Add Task to create a new task.
- Enter the necessary details to complete the task assignment.
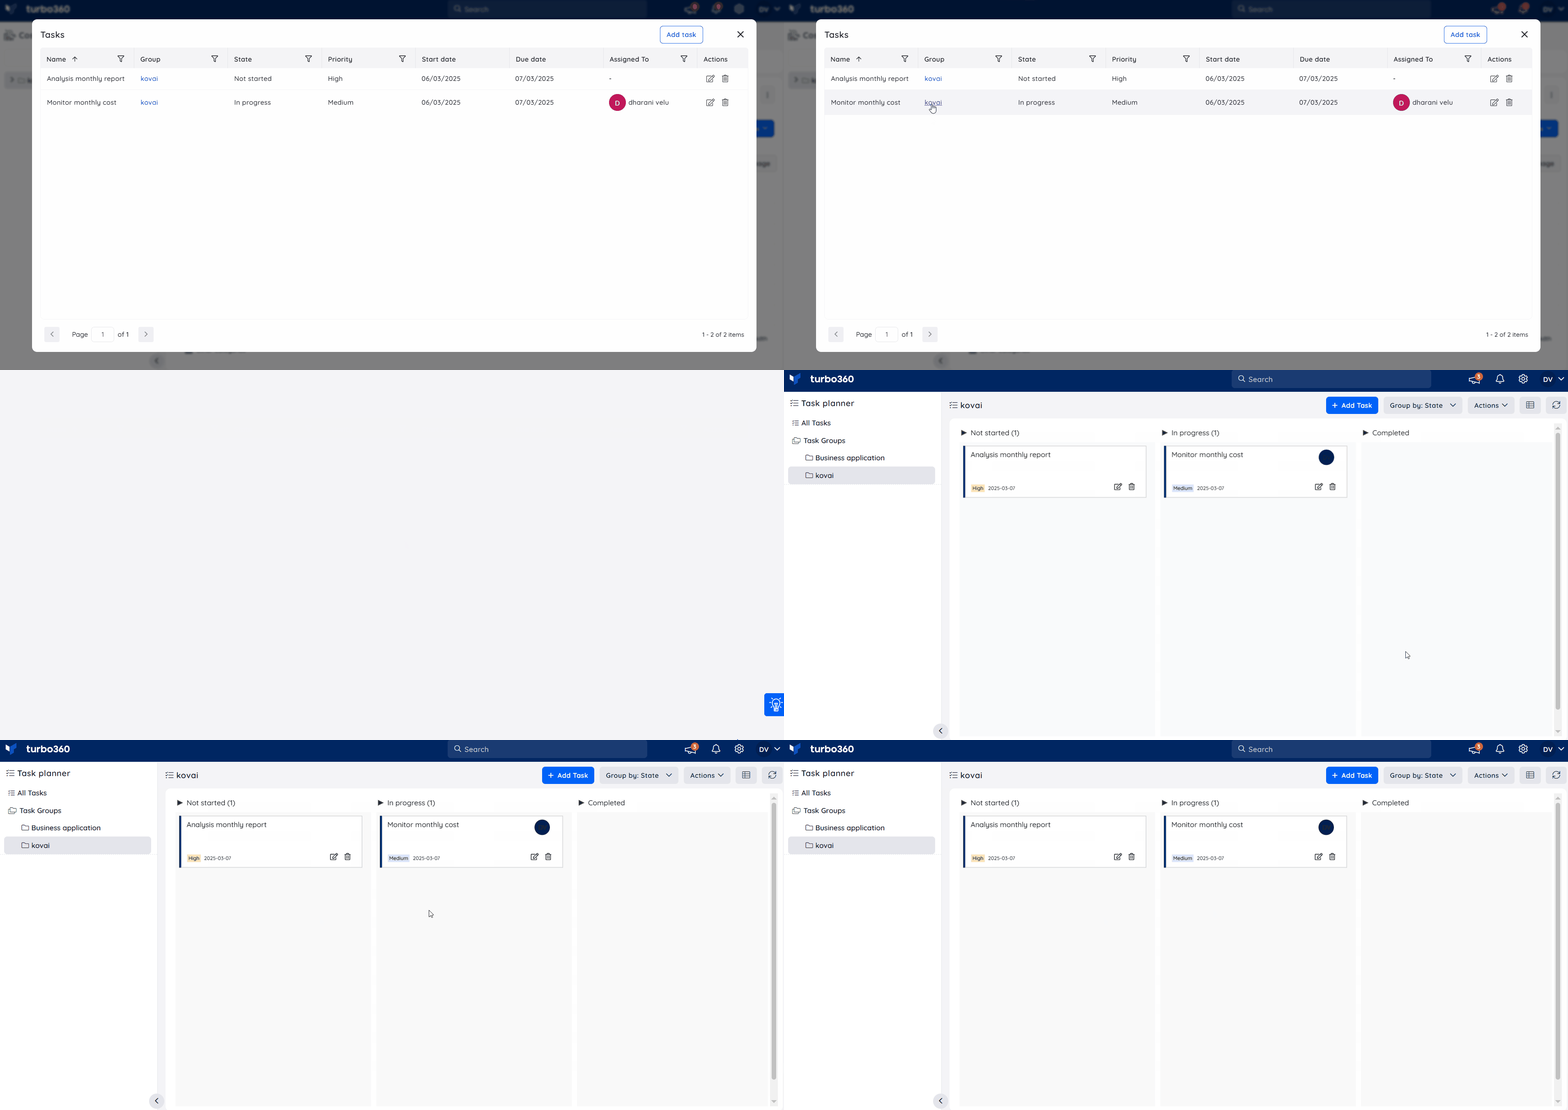
- Edit or delete tasks using the respective buttons within the module.
- Use the navigation link to access the global Task planner section. Updates made there reflect automatically on the Cost Analyzer task board.
Scheduled export
- The Export feature in Analysis lets you export cost data and insights from the analysis view.
- Recurring exports can be scheduled daily, weekly, or monthly to deliver data automatically to configured notification channels.
- Exported data is available in Excel (.xlsx) format and includes all cost data shown in the analysis view.
Setting up scheduled exports
Scheduling an export automates recurring delivery of cost data from the current analysis view to your configured notification channels.
- Navigate to the Analysis section within the required cost management group.
- Configure the analysis view to match the recurring cost tracking requirement, then save it.
- Select Actions > Export to configure the export schedule.
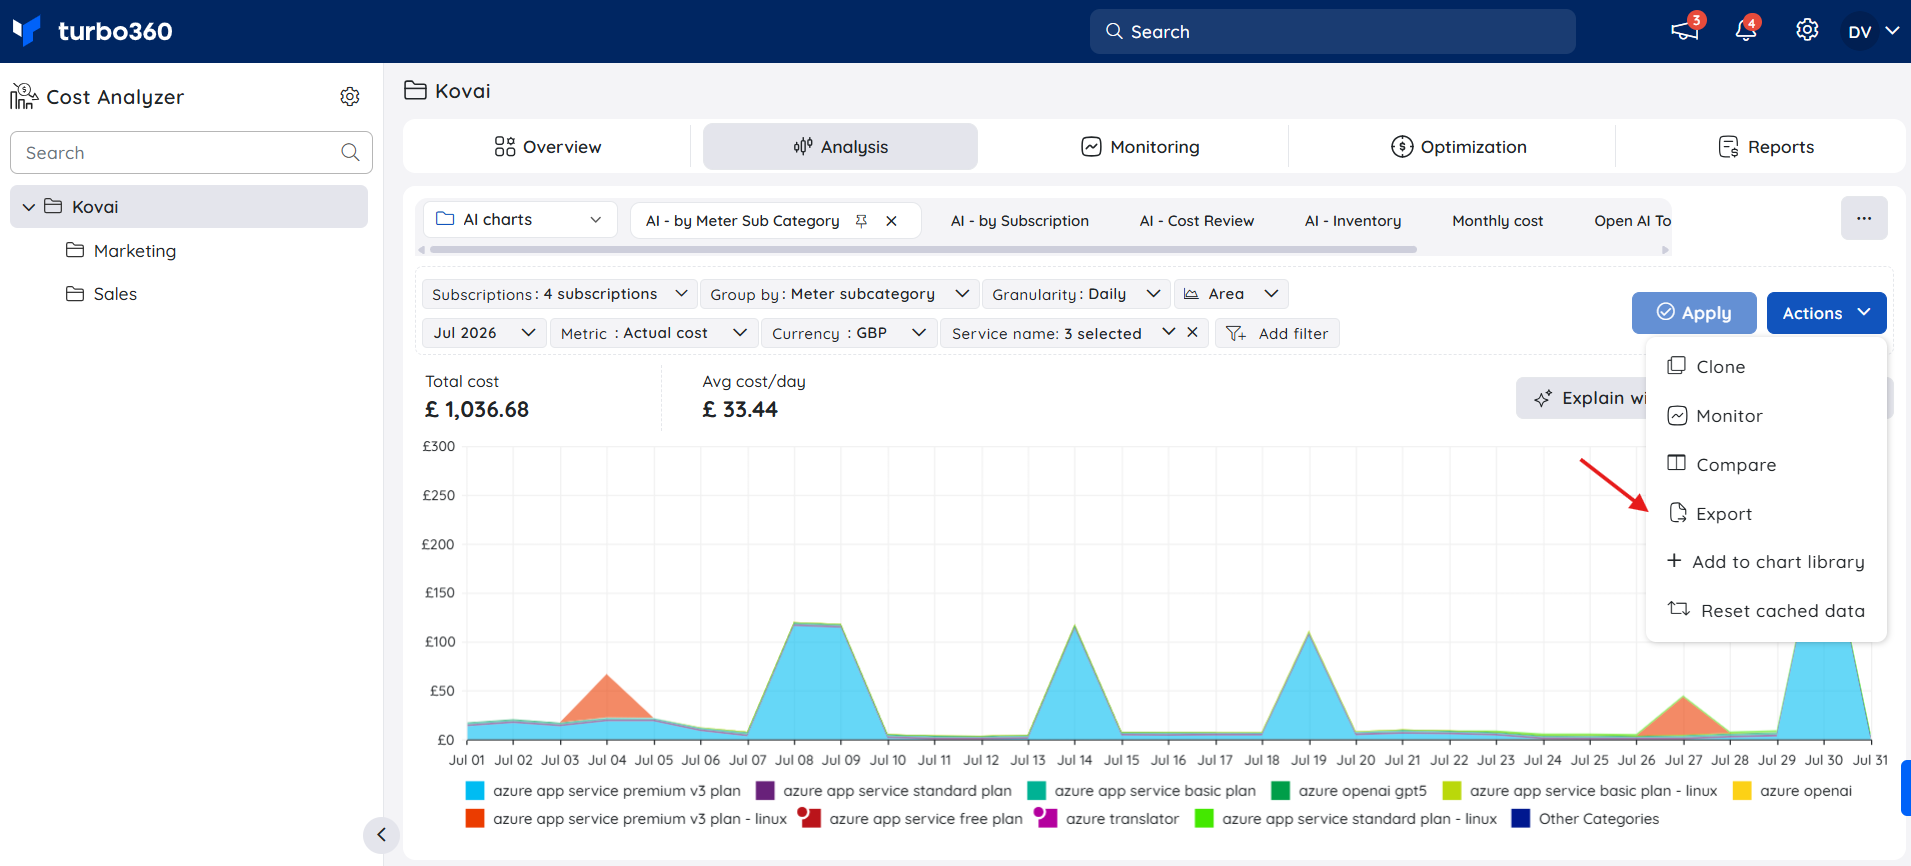
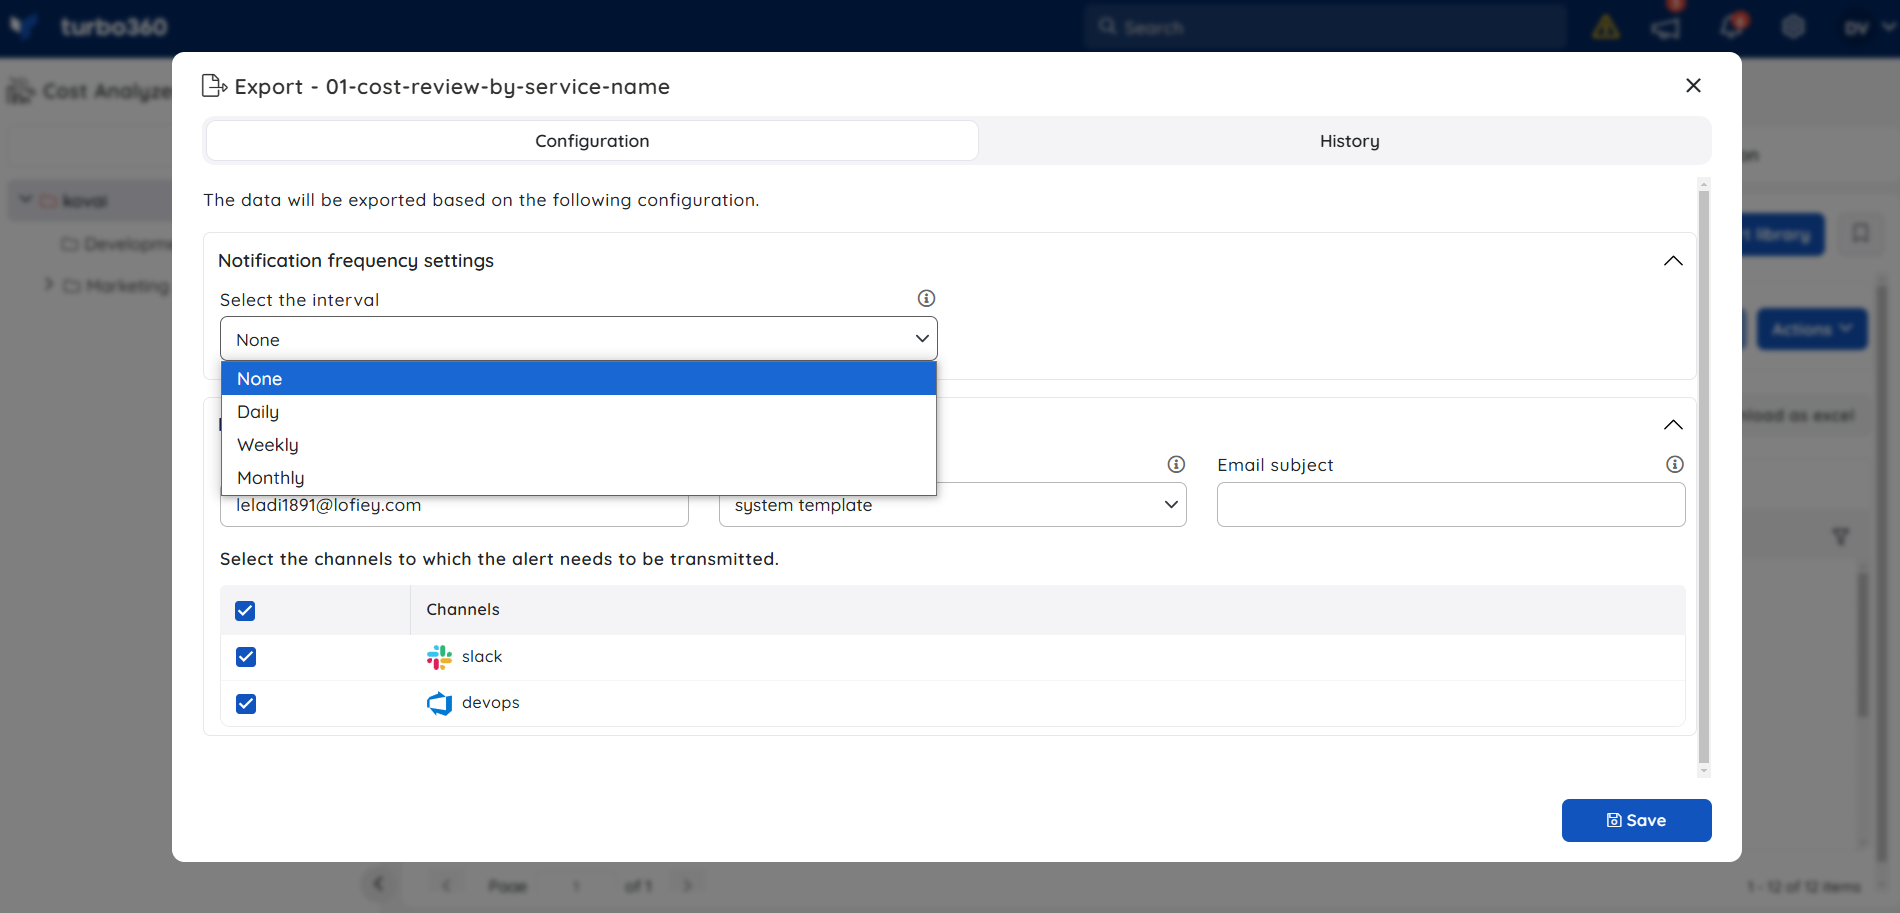
- Specify the export frequency.
- Configure the required notification services.
- Enable Download the exported data from notifications (open link) to access the export directly from the alert.
- Click Save to apply the settings.
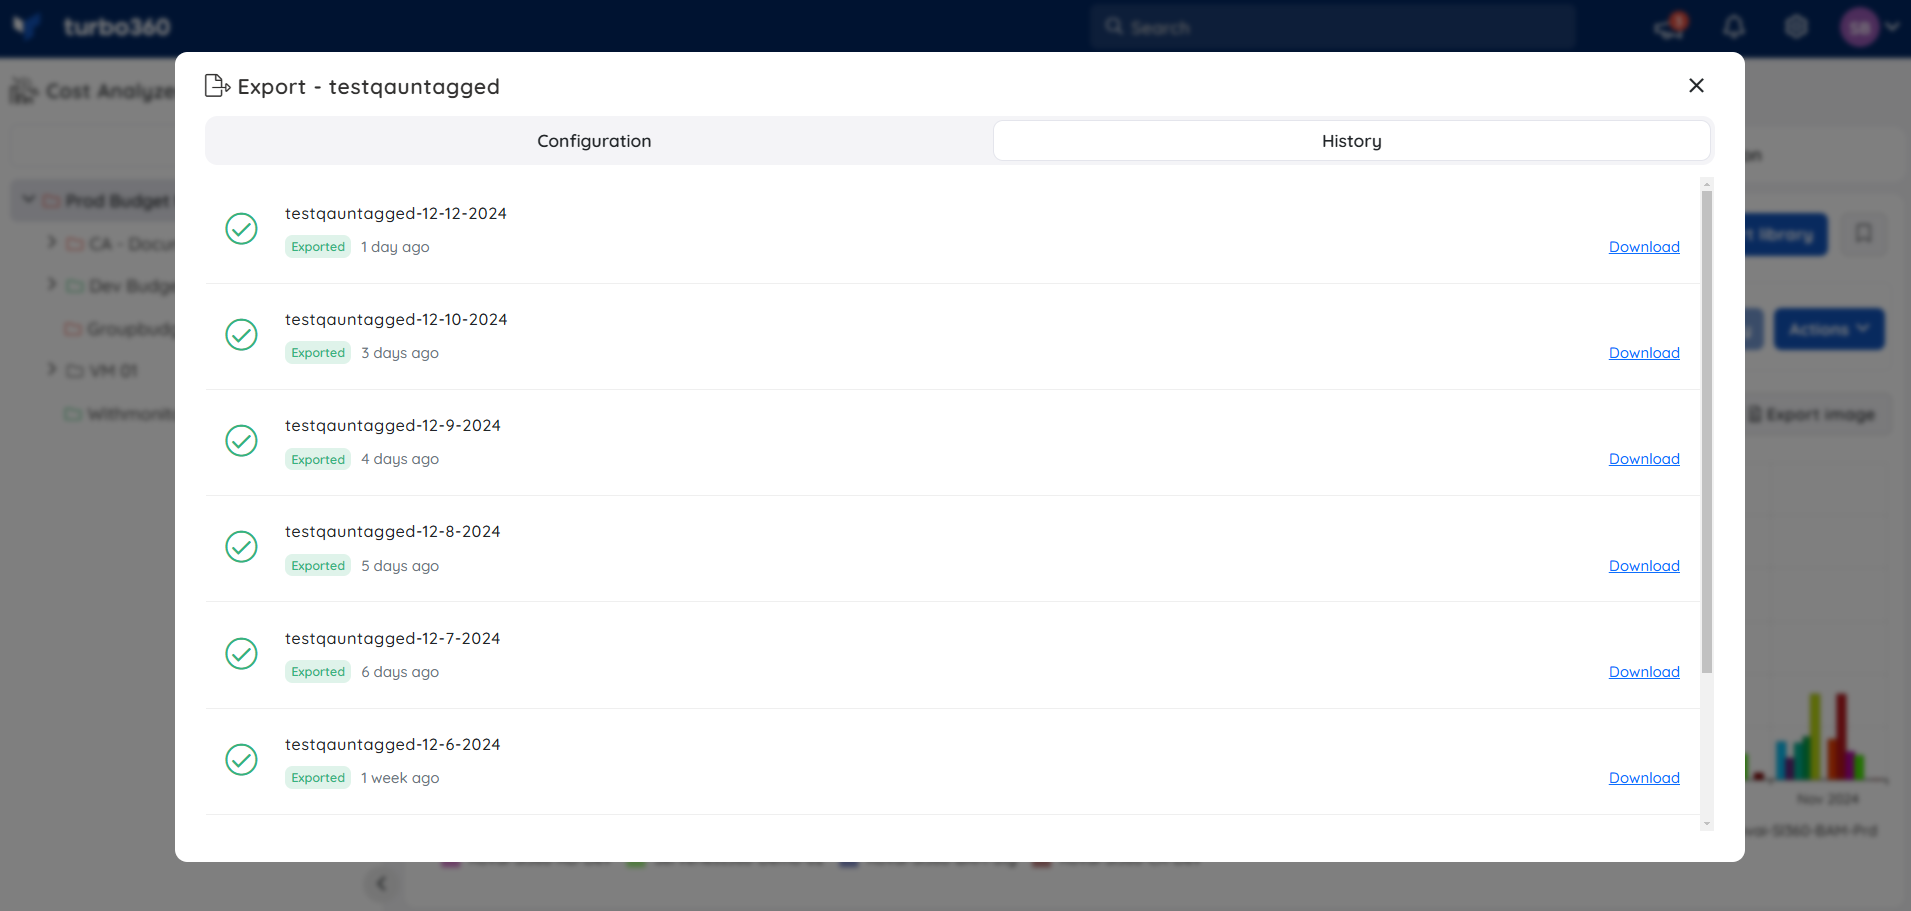
Use the History tab to access and download past exports.
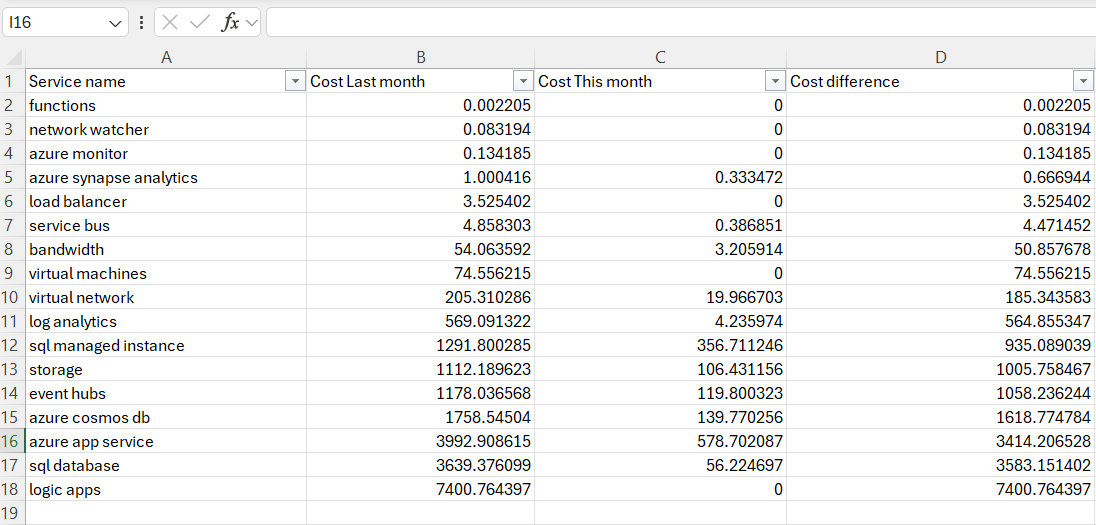
Sample export data
The image below illustrates sample exported data generated for an analysis view within a cost management group.
Limitations
- The Table chart's Compare option is available only when Granularity is set to None.
- Within a monitor created from a view, you can only view the subscription and filters already configured in the monitoring rule — adding subscriptions or modifying filters there isn't supported.
Related articles
Was this article helpful?