

Managing resource dashboards
- 05 Aug 2026
- 5 Minutes to read
- Print
- DarkLight
- Download PDF
Managing resource dashboards
- Updated on 05 Aug 2026
- 5 Minutes to read
- Print
- DarkLight
- Download PDF
Article summary
Did you find this summary helpful?
Thank you for your feedback!
Overview
Resource dashboards in Turbo360 support the same management actions as Business Application dashboards, with one additional capability: you can save resource dashboard widgets directly to a Business Application dashboard. This article covers all resource dashboard management operations, including time settings, widget editing, full-screen mode, zoom, the Metrics tab, saving to the main dashboard, and downloading.
Business value
Managing resource dashboards directly within Turbo360 removes the need to context-switch to the Azure portal for resource-level metric review. The Metrics tab lets you run ad-hoc queries against any available Azure metric for a resource — without building a permanent widget — making it practical for incident investigation and one-off checks. The ability to save resource widgets to the main Business Application dashboard means that operational signals from a specific resource can be surfaced in the shared application view, giving your team visibility without requiring each member to navigate to the individual resource.
How it works
Resource dashboard management actions are available from the Overview tab of each resource. The Dashboard tab shows pre-configured and custom widgets. The Metrics tab lets you query any available Azure metric for the resource on demand. Time settings control the data window for all widgets in the Dashboard tab. The Save to main dashboard option copies selected widgets to an existing or new Business Application dashboard.
Permissions
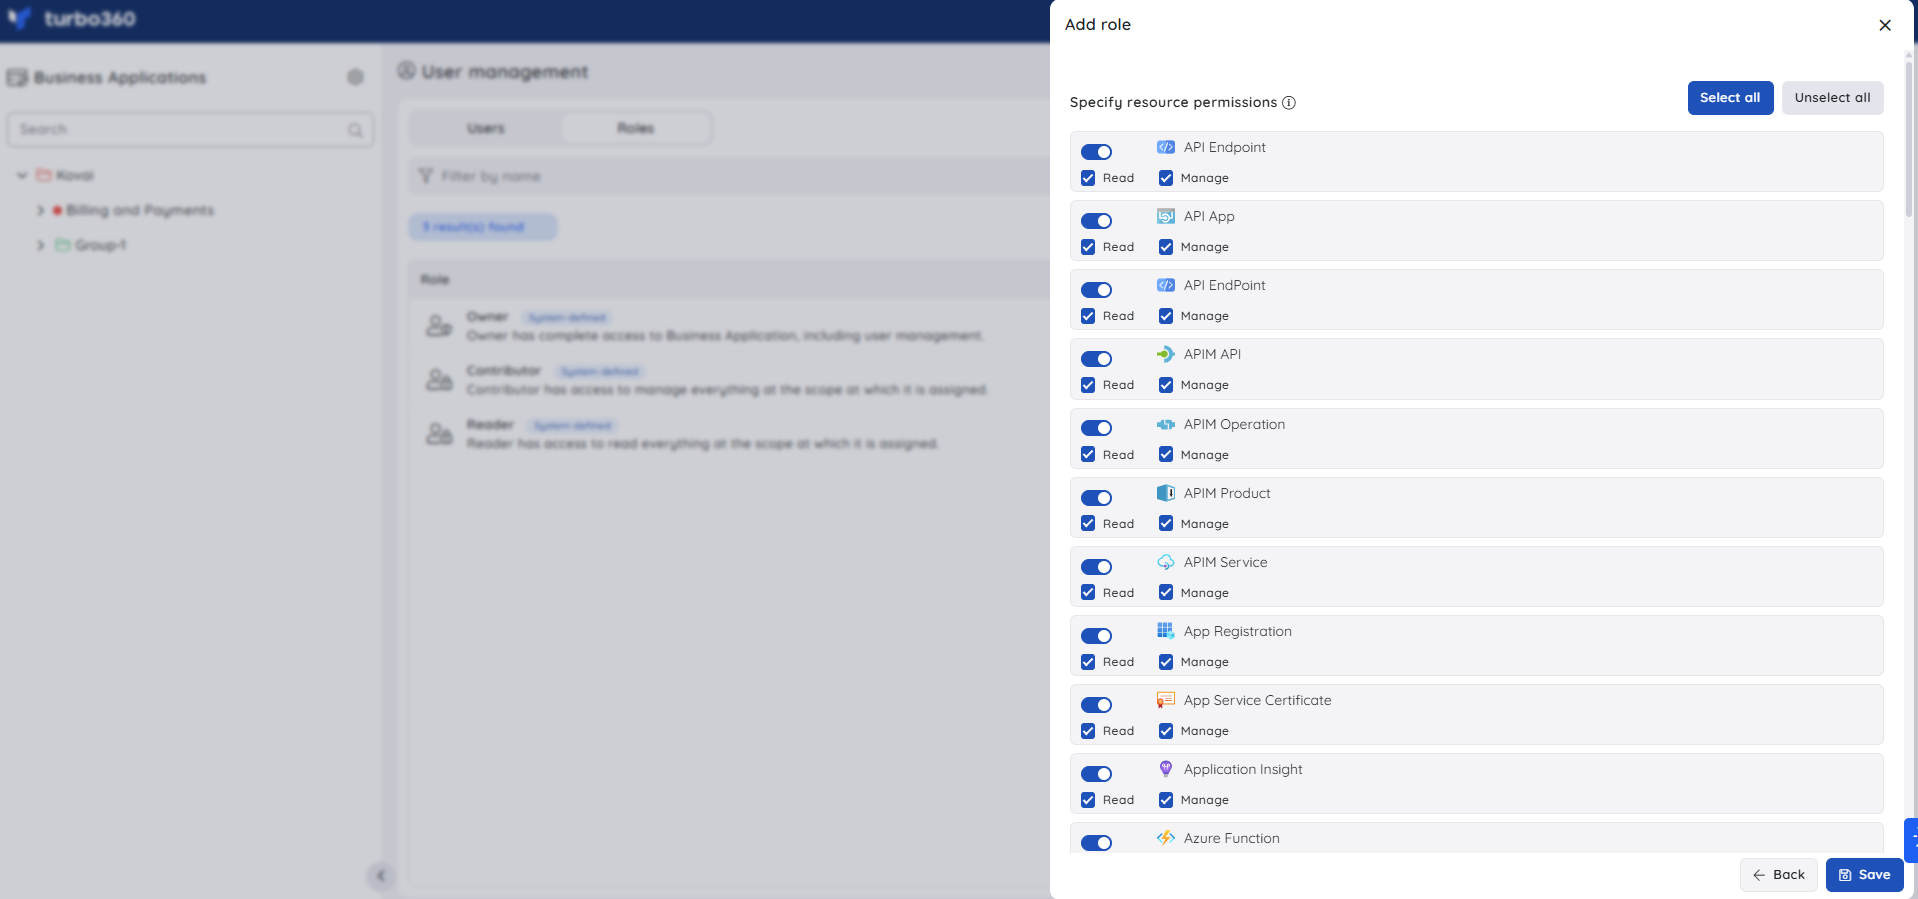
Resource dashboard management is controlled by a combination of the resource-level permission and the Dashboard feature permission.
| Access level | What you can do |
|---|---|
| Resource-level Read + Dashboard Read | View resource dashboard widgets; use full-screen mode and zoom |
| Resource-level Manage + Dashboard Read | Add, edit, delete, and reorder resource dashboard widgets |
| Resource-level Manage + Dashboard Manage | All of the above; save resource dashboards to the main Business Application dashboard |
.png)
Steps
Use the following steps to manage resource dashboards. Select a resource from the tree view and navigate to Overview to get started.
Configure time settings
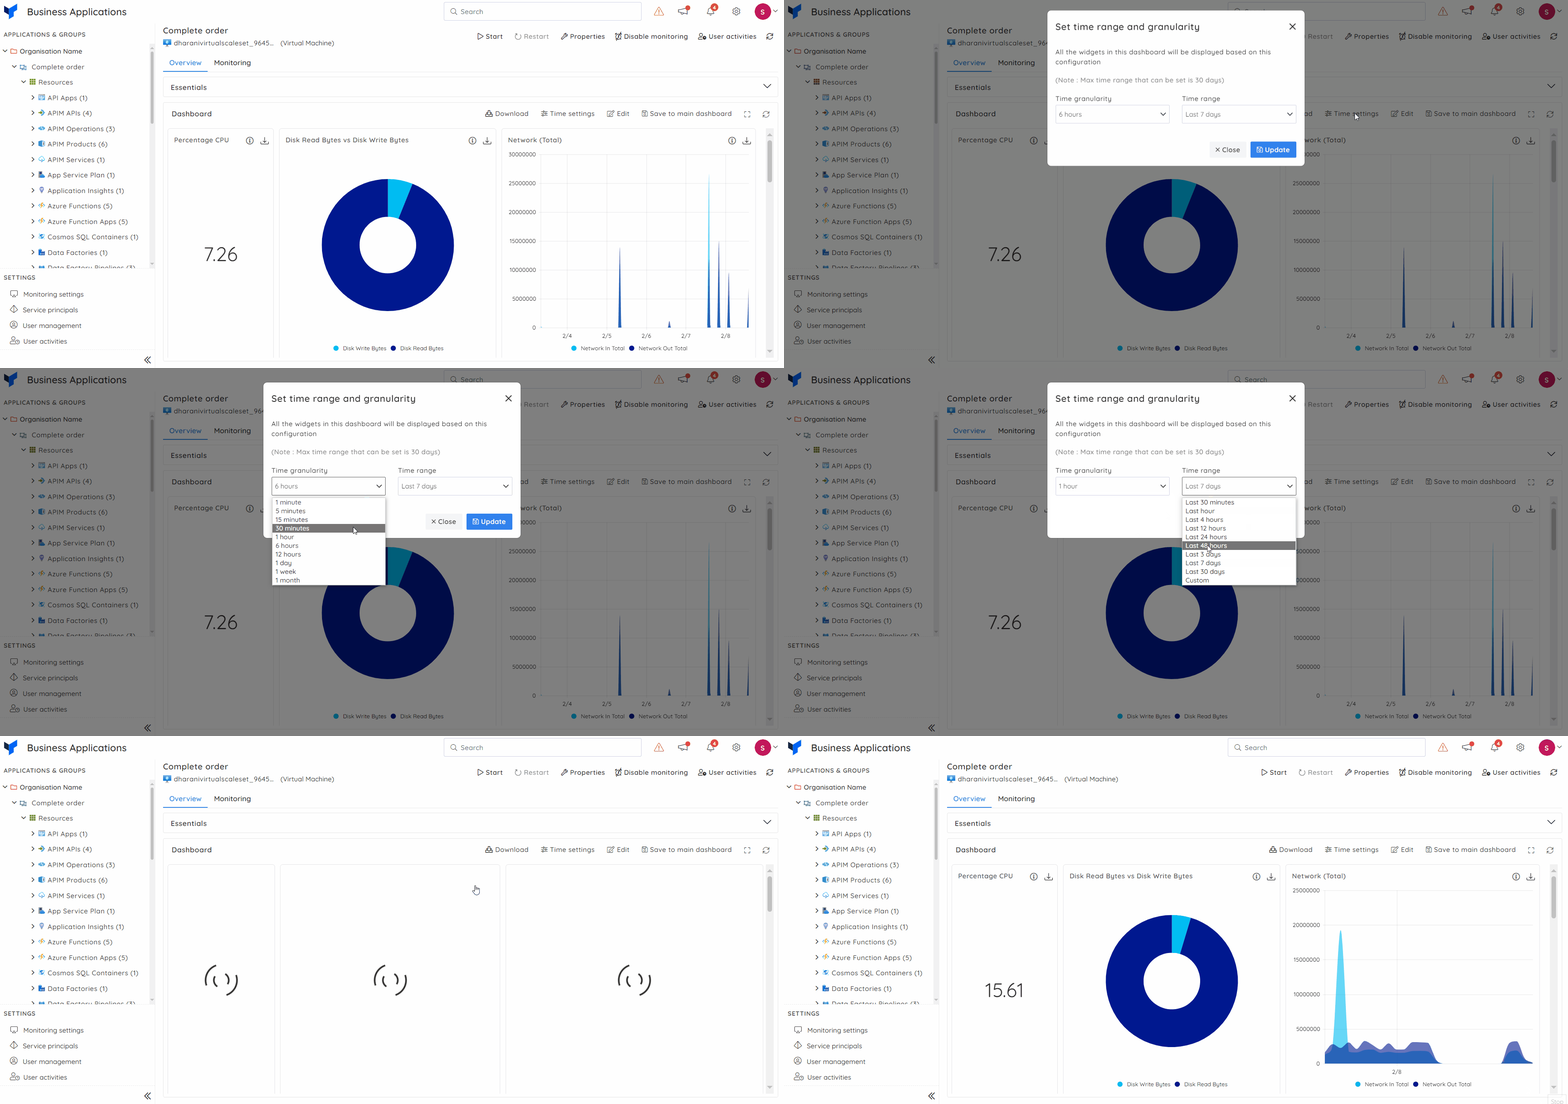
Configuring time settings lets you change the data window for all widgets in the resource dashboard without modifying individual widget configurations.
The Time Range controls the overall period for which data is shown. The Time Granularity controls the resolution of data points within that range. The default is Time granularity — 5 min; Time range — 1 hour. The maximum range you can set is 90 days.
Note:
Time settings are per-account. Your customized values are visible only to you. Other users see the default values.
- Select Time settings in the resource dashboard header.
- Set your preferred Time Range and Time Granularity values.
- Select Apply to update all widgets.
Edit widgets
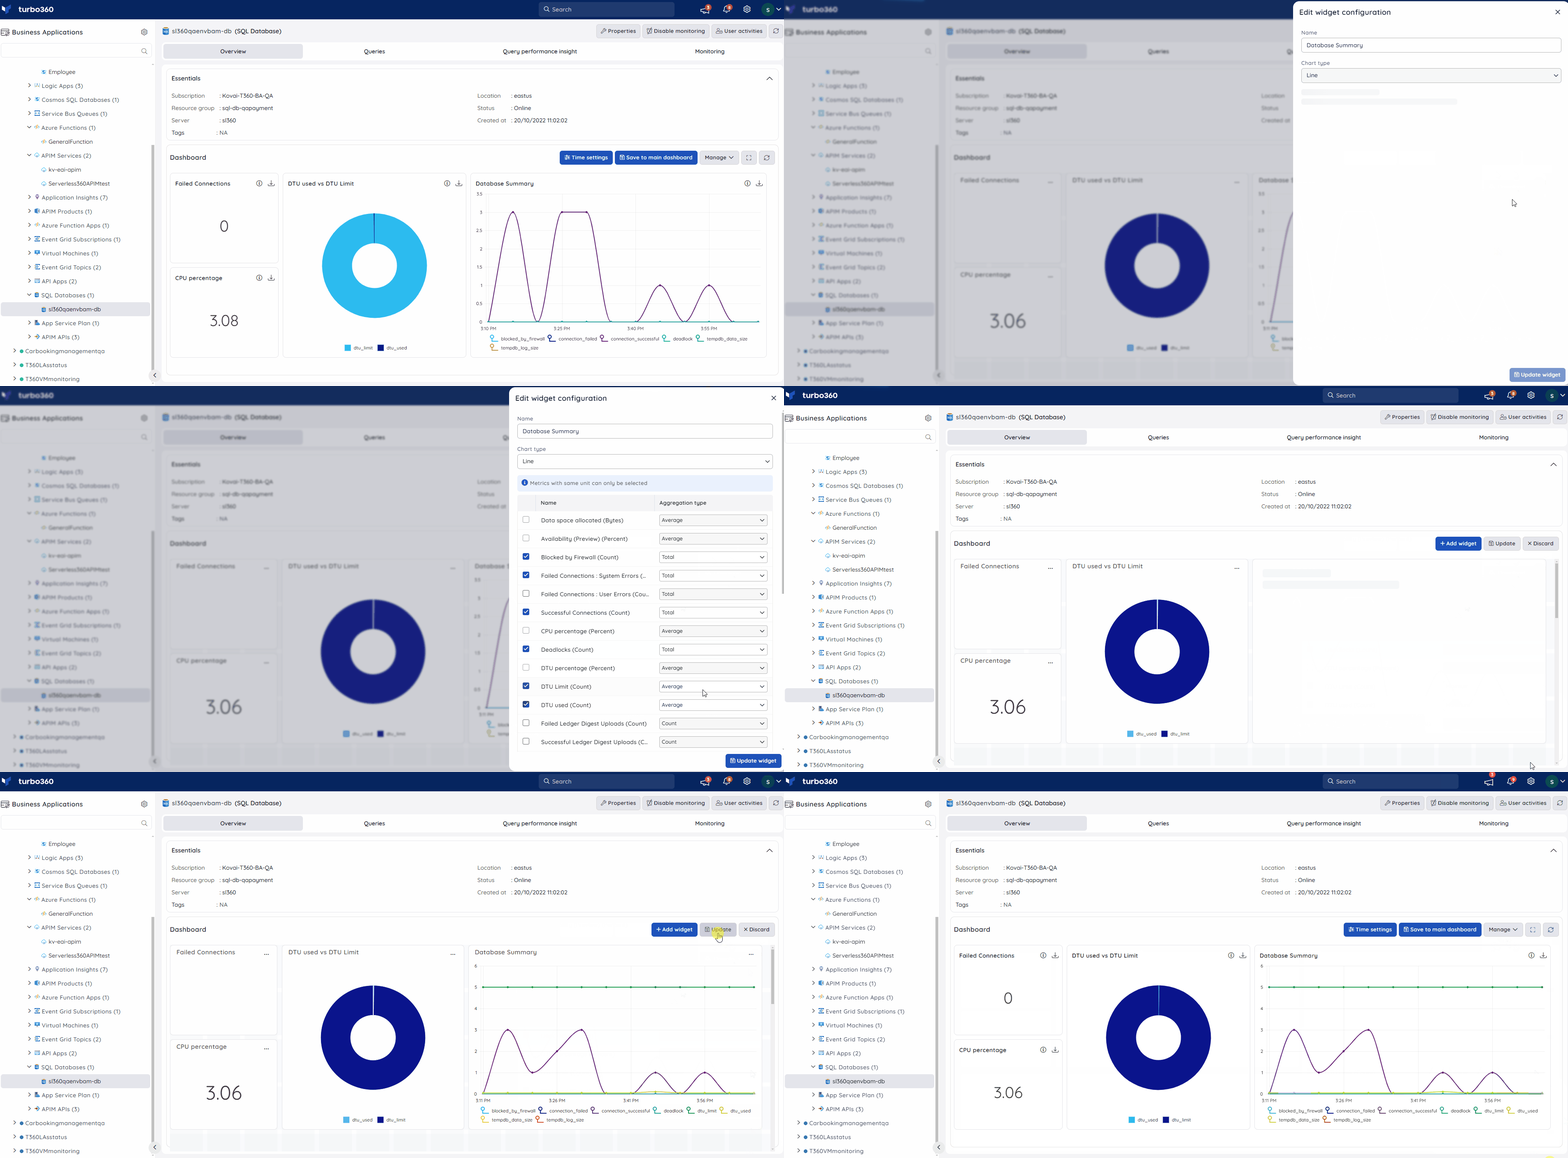
Editing a widget lets you add, update, or remove resource dashboard widgets. The chart type is fixed at creation and cannot be changed.
- Select Edit in the resource dashboard header.
- To add a widget, select Add widget and configure the metric, chart type, and time settings.
- To modify an existing widget, select the Edit icon on the widget and update the configuration.
- To delete a widget, select the Delete icon on the widget.
- Save your changes.
Enable full-screen mode
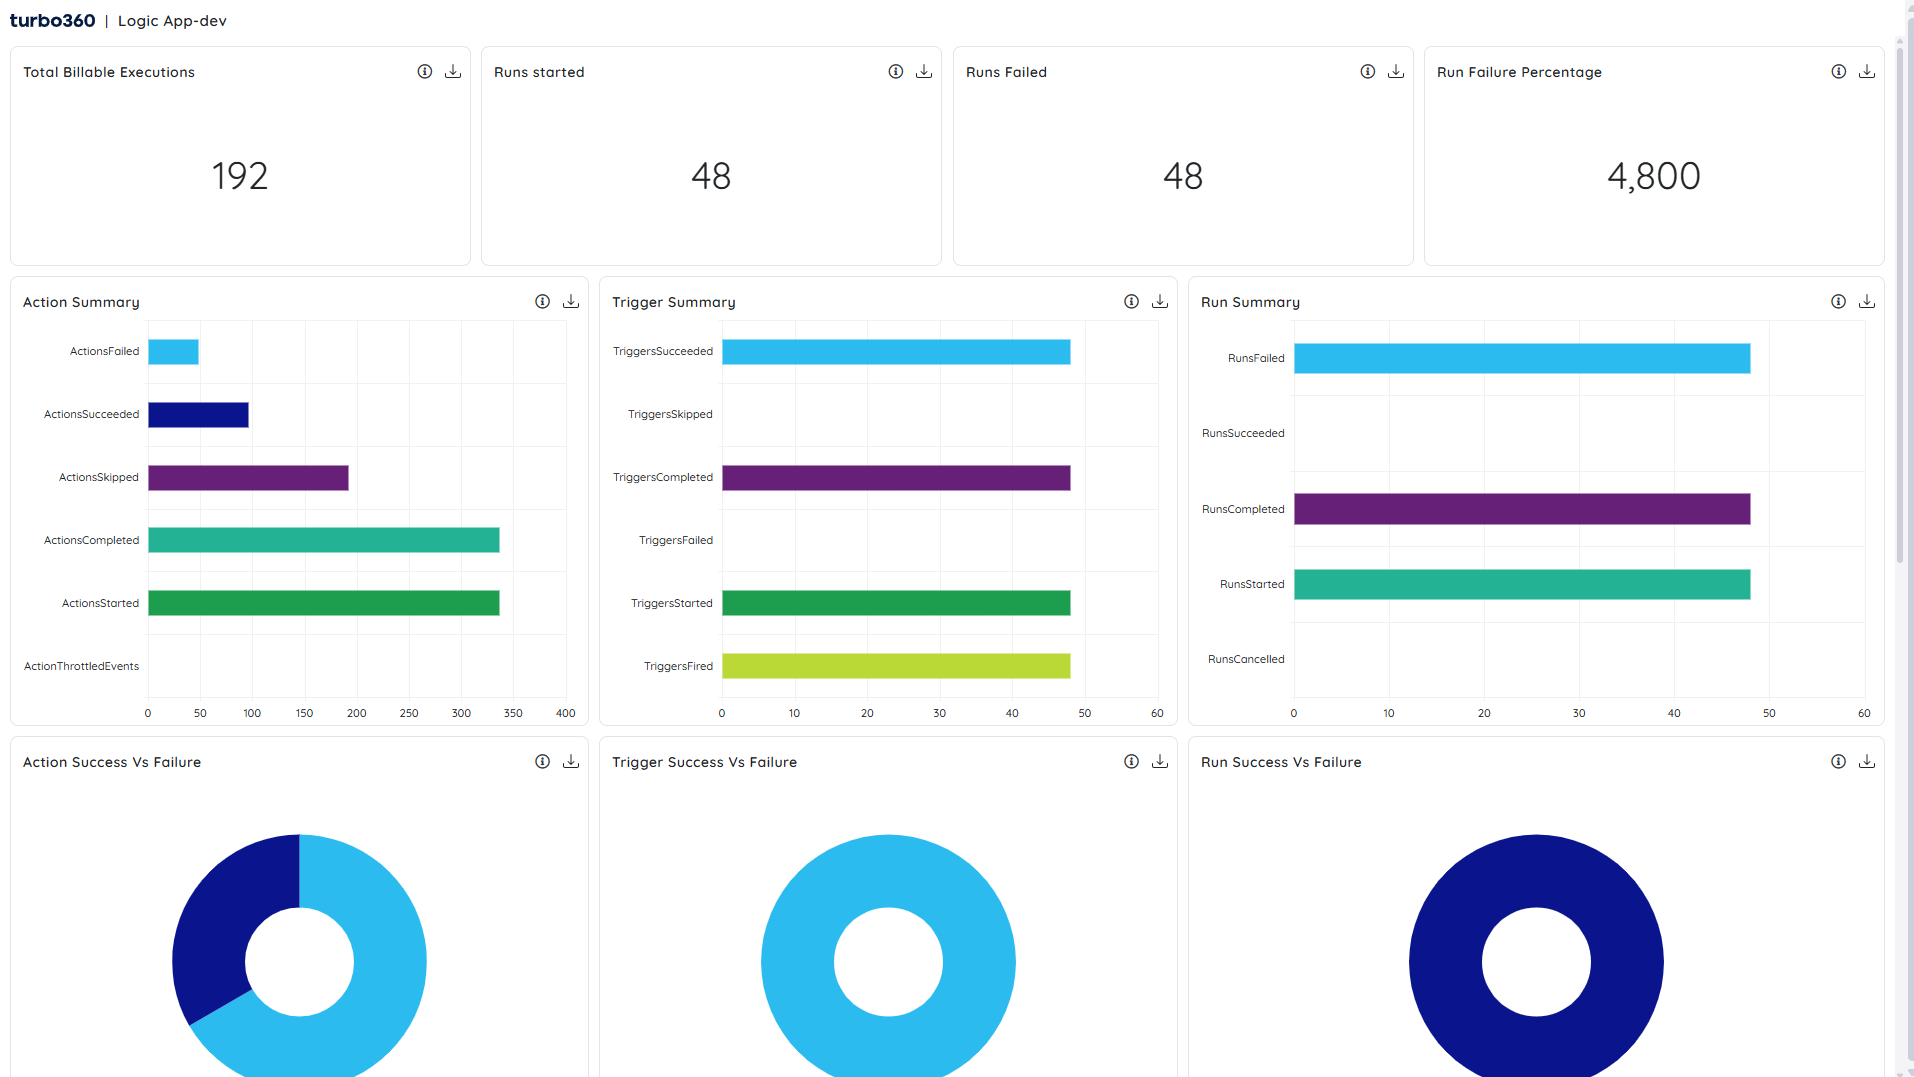
Full-screen mode expands the resource dashboard to fill the screen for focused metric review.
- Select the Full screen icon in the resource dashboard header.
- Press Escape or select the exit icon to return to the standard view.
Zoom in and zoom out
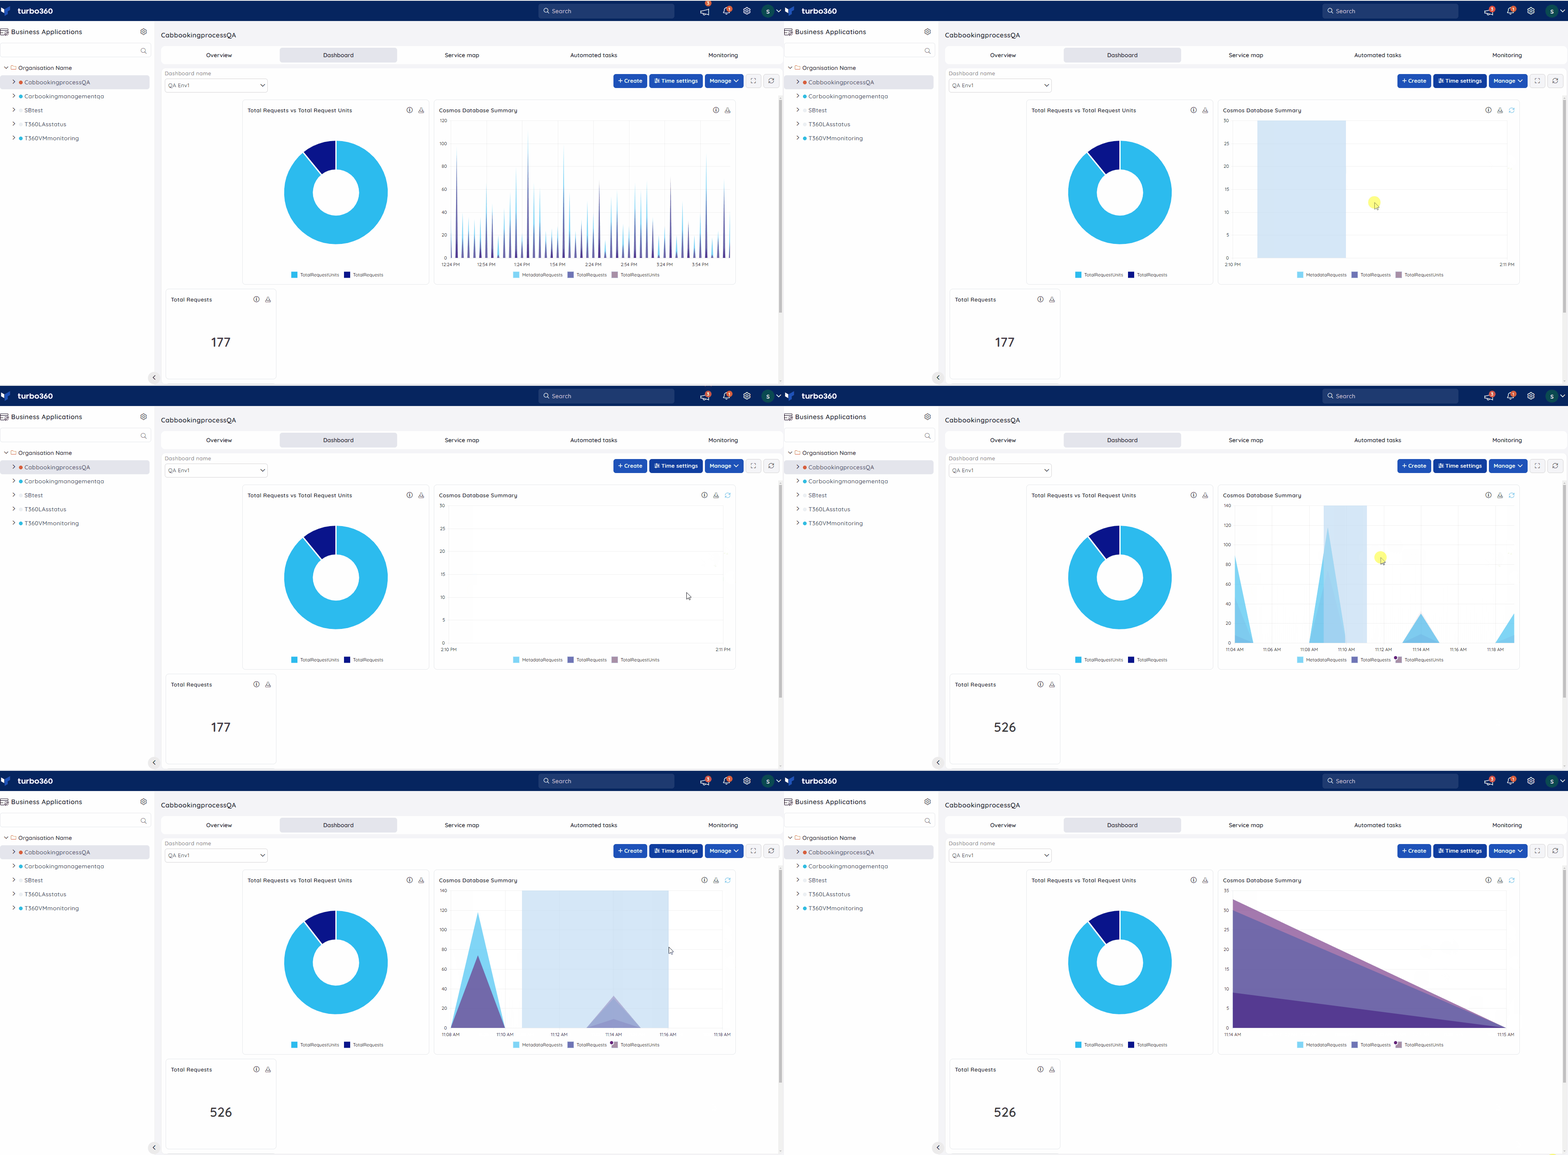
Zooming lets you focus on a specific data region within a chart widget.
- Click and drag within a chart widget to zoom into the selected range.
- Select Undo Zoom within the widget to return to the full view.
Save resource dashboard to main dashboard
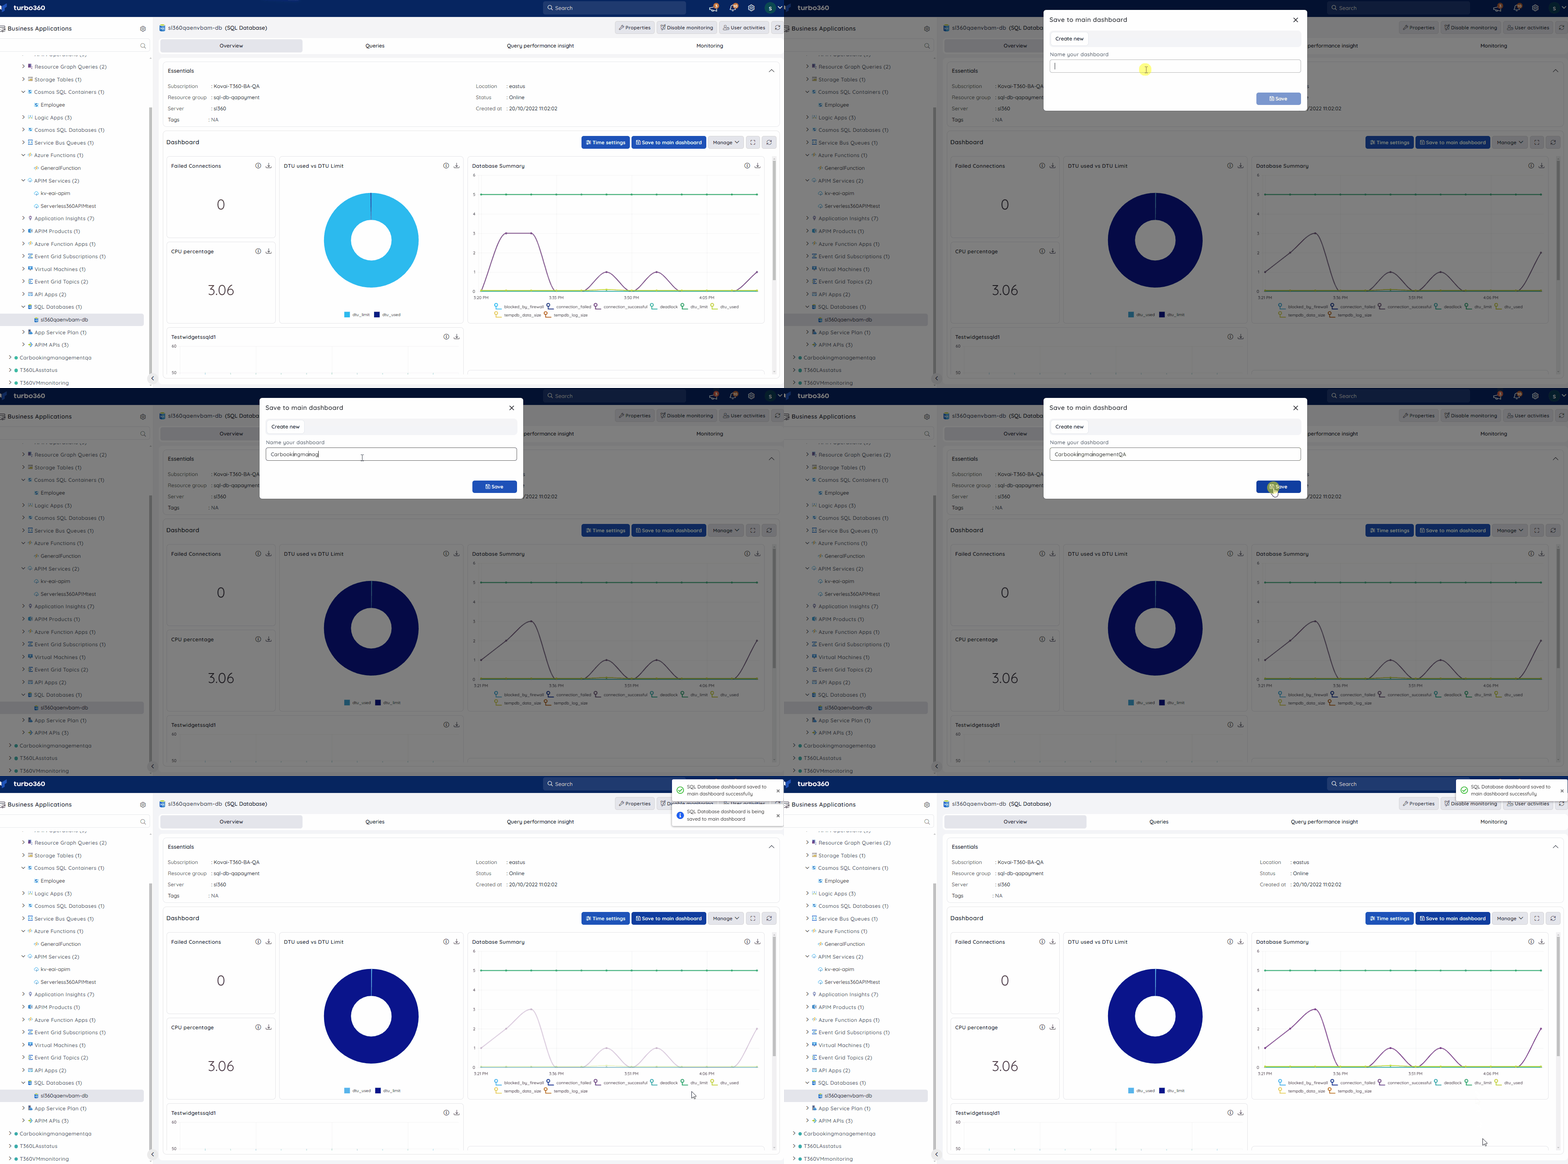
Saving a resource dashboard to the main dashboard promotes resource-level widget data to the Business Application dashboard, making it visible to everyone with Dashboard access on the Business Application. You can save to an existing Business Application dashboard or create a new one during the save process. This operation requires Dashboard Manage permission.
- Select Save to main dashboard from the resource dashboard header.
- Select an existing Business Application dashboard or create a new one.
- Confirm the save.
Download resource dashboard data
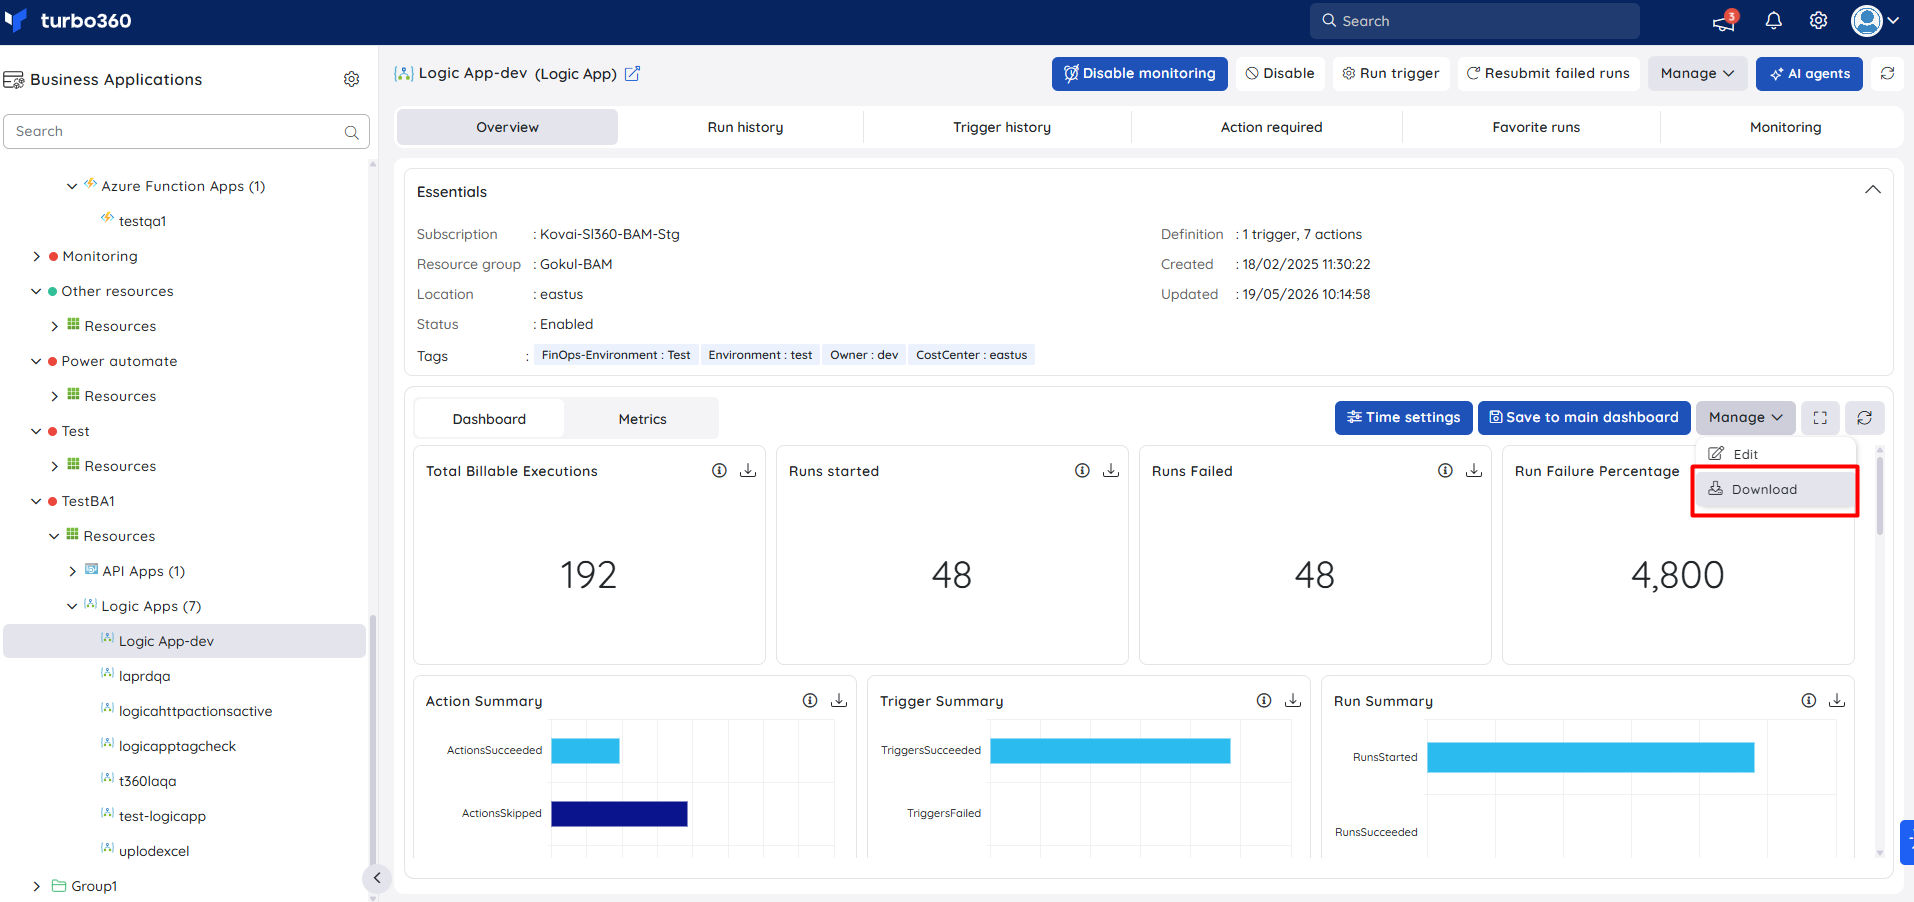
Downloading exports all widget data from the current resource dashboard as an Excel workbook, with a separate sheet for each widget.
- Select the Download option in the resource dashboard header.
- Save the generated Excel workbook.
Metrics tab
The Metrics tab lets you query any available Azure metric for the resource on demand, without creating a permanent widget. Navigate to the resource in the tree view, select Overview, then select the Metrics tab.
.png)
The Metrics tab provides five controls:
| Control | Description |
|---|---|
| Select metric | Choose the Azure metric to visualize. Up to 37 metrics are available depending on the resource type. |
| Aggregation | Set how data points are combined — for example, Average, Sum, Minimum, or Maximum. |
| Time range | Set the historical window for which to retrieve metric data — for example, Last 24 hours. |
| Granularity | Set the interval between data points within the selected time range — for example, 1 hour. |
| Chart type | Choose how to render the data — for example, Line. |
Once you have set your preferred controls, select Apply to visualize the data.
Note:
The data query will be saved for the resource in the Metric tab until modified.
Troubleshooting
Save to main dashboard option is not visible
Cause: The user has Dashboard Read permission instead of Dashboard Manage permission. This option requires Dashboard Manage permission.
Fix: Assign Dashboard Manage permission to the user's role via User management > Roles.Resource dashboard widgets are not updating after editing
Cause: Changes may not have been saved, or the dashboard is still loading after an edit.
Fix: Confirm the save completed successfully. Refresh the page if widgets do not update within a few seconds.Time settings reset after navigating away
Cause: Time settings are per-account session values and reset when the session ends.
Fix: Re-apply your preferred time settings after each session.Metrics tab shows no data after selecting Apply
Cause: The selected metric has no data for the chosen time range, or the Azure resource has not emitted that metric recently.
Fix: Expand the time range. Try a different metric to verify the resource is actively emitting data.Download produces an empty Excel file
Cause: There is no data in the current time window for the resource dashboard widgets.
Fix: Expand the time range and retry the download.
Related articles
Was this article helpful?