

Rules configuration
- 05 Aug 2026
- 8 Minutes to read
- Print
- DarkLight
- Download PDF
Rules configuration
- Updated on 05 Aug 2026
- 8 Minutes to read
- Print
- DarkLight
- Download PDF
Article summary
Did you find this summary helpful?
Thank you for your feedback!
Overview
Configuring a monitoring rule lets you define exactly how Turbo360 evaluates an Azure resource's health — what value it tracks, the rule type applied, and the thresholds that decide when the resource is in a warning or error state.
This article covers rule types, threshold behavior, metric aggregation, and the rule-driven actions available once a rule is in place: auto-correction, automated tasks, and resolution notes.
Business value
Granular rule configuration lets you tune monitoring to match each resource's real-world behavior, reducing false alerts and ensuring violations reflect genuine issues instead of noise.
How it works
Rule types
A monitoring rule for a resource can be one of the following types:
- Property — indicates the current value of the selected rule.
- Metric — indicates the value obtained based on the aggregation period set in the monitoring settings at the Business Application level or Monitoring profile level.
- Status — indicates one of the available values specific to each rule.
- Availability Status — indicates the availability of the resource.
For a Property or Metric rule, threshold values can be any positive number. For a Metric rule, the threshold can also be set to any metric belonging to the chosen resource type. Its value is evaluated based on the aggregation period set in the monitor settings each time the rules evaluation frequency triggers an evaluation cycle.
Threshold types
You can set two types of threshold values for a rule:
- Warning threshold
- Error threshold
Monitor evaluation determines that a rule has been violated when its current value exceeds either threshold. The Error threshold takes priority for alert generation when both threshold values are met during the same monitoring cycle.
Selecting aggregation types
Each resource metric supports a list of aggregation types. Choose the one that best matches how you want the metric evaluated over the configured aggregation period.
The image below shows the supported aggregation types for the Connections metric on an Azure Function App:
.png)
Configuring rules
Monitoring rules can be configured from Business Application > Resources > [Resource] > Monitoring for resource-level rules, or from Settings > Monitoring settings > Monitoring profiles for profile-level rules.
The image below shows the monitoring section of a Function App resource:
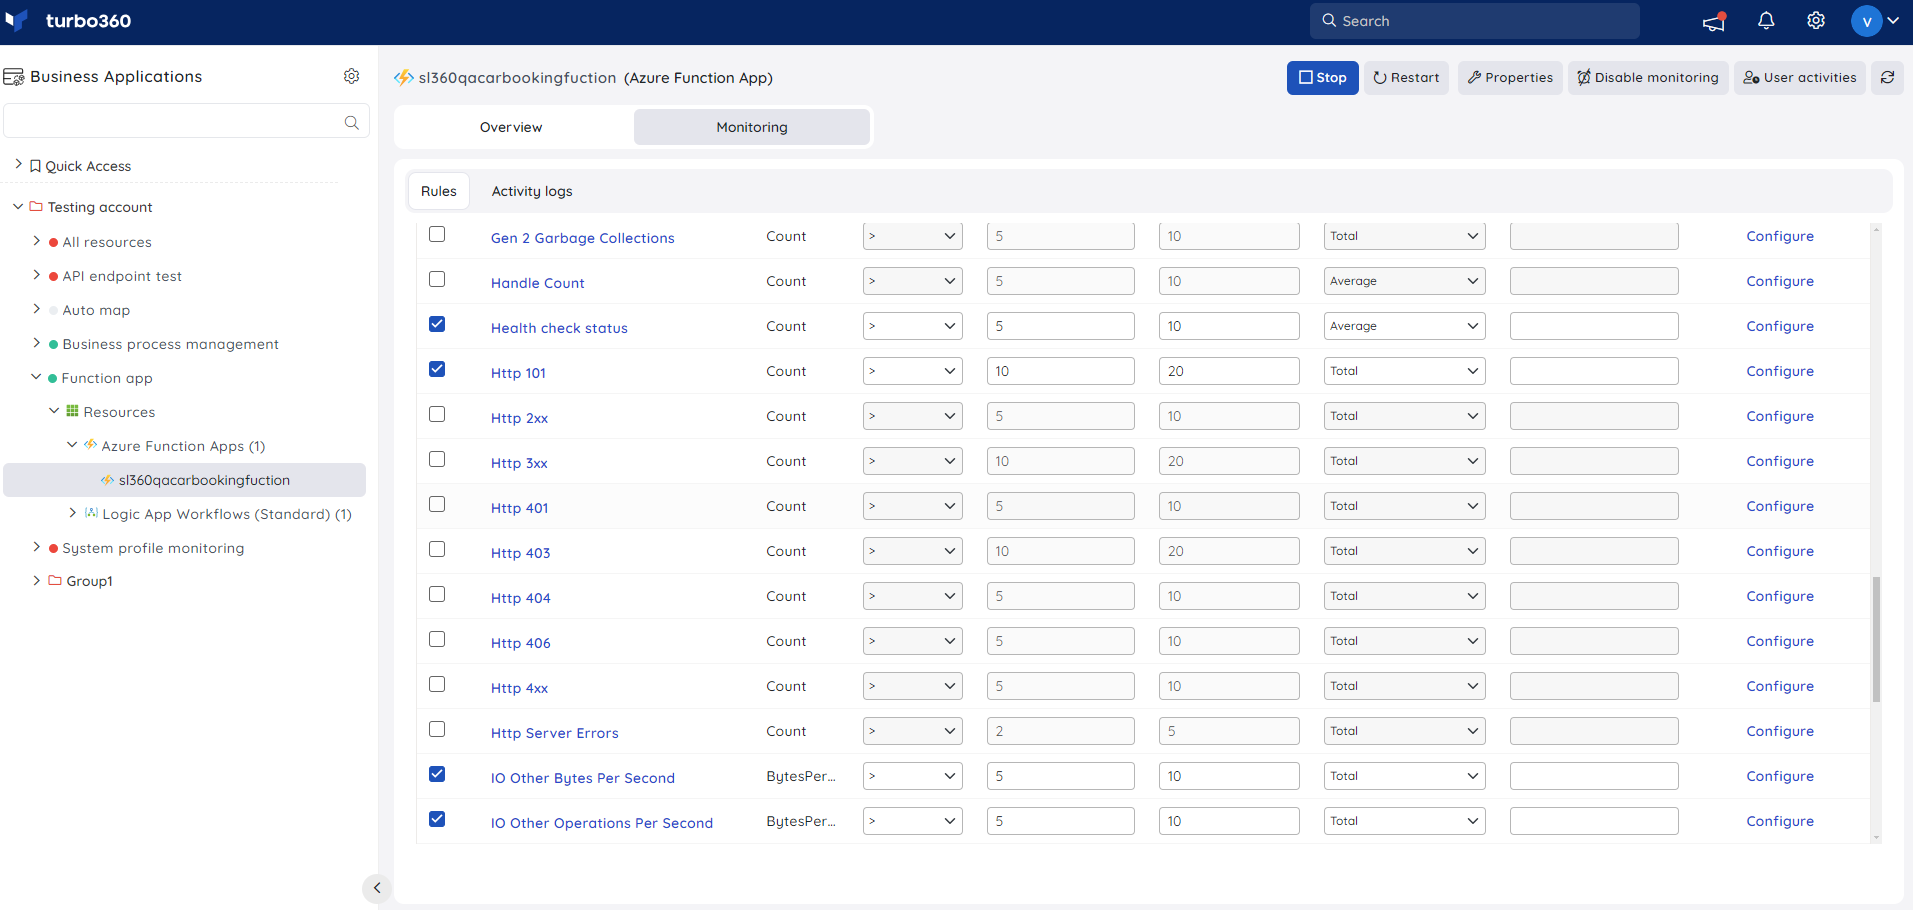
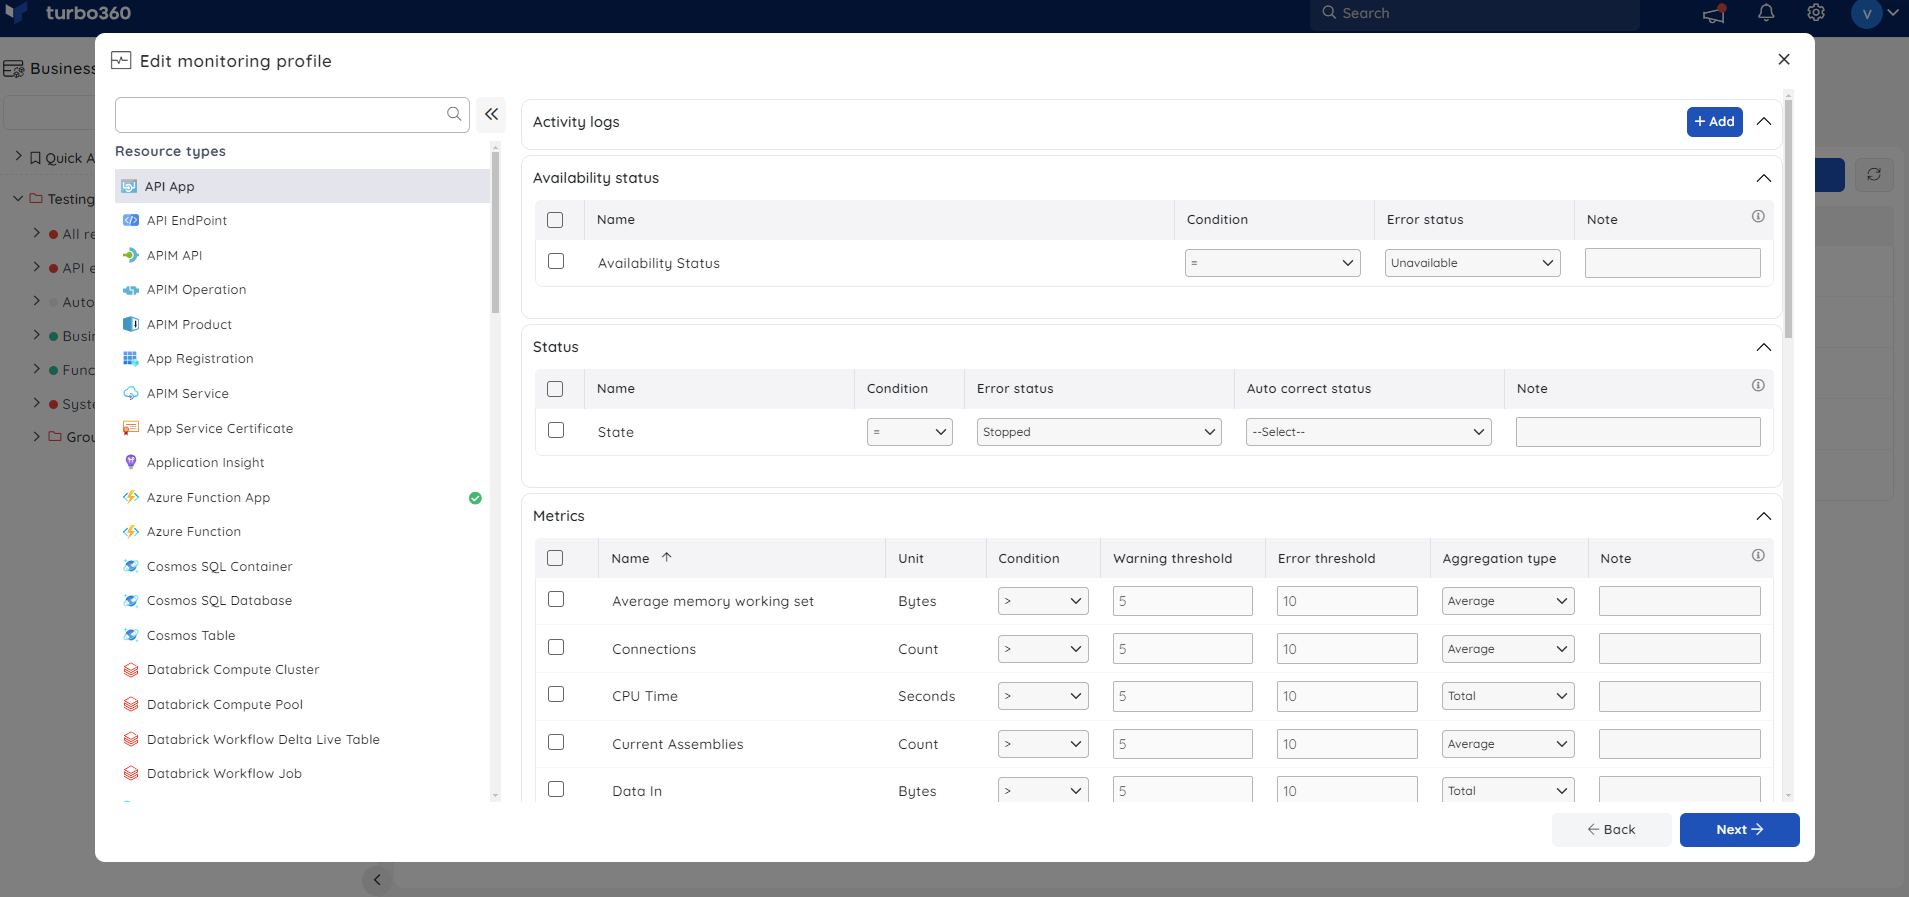
For rule types, thresholds, aggregation settings, and rule-driven actions such as auto-correction, automated tasks, and resolution notes, see Monitoring rules configuration.
Metric visualization
The usage pattern of a parent resource metric can be visualized through a chart, accessible from Business Application > Resources > [Resource] > Monitoring > [Metric]. The blue hue on a metric indicates that a data visualization is available for it.
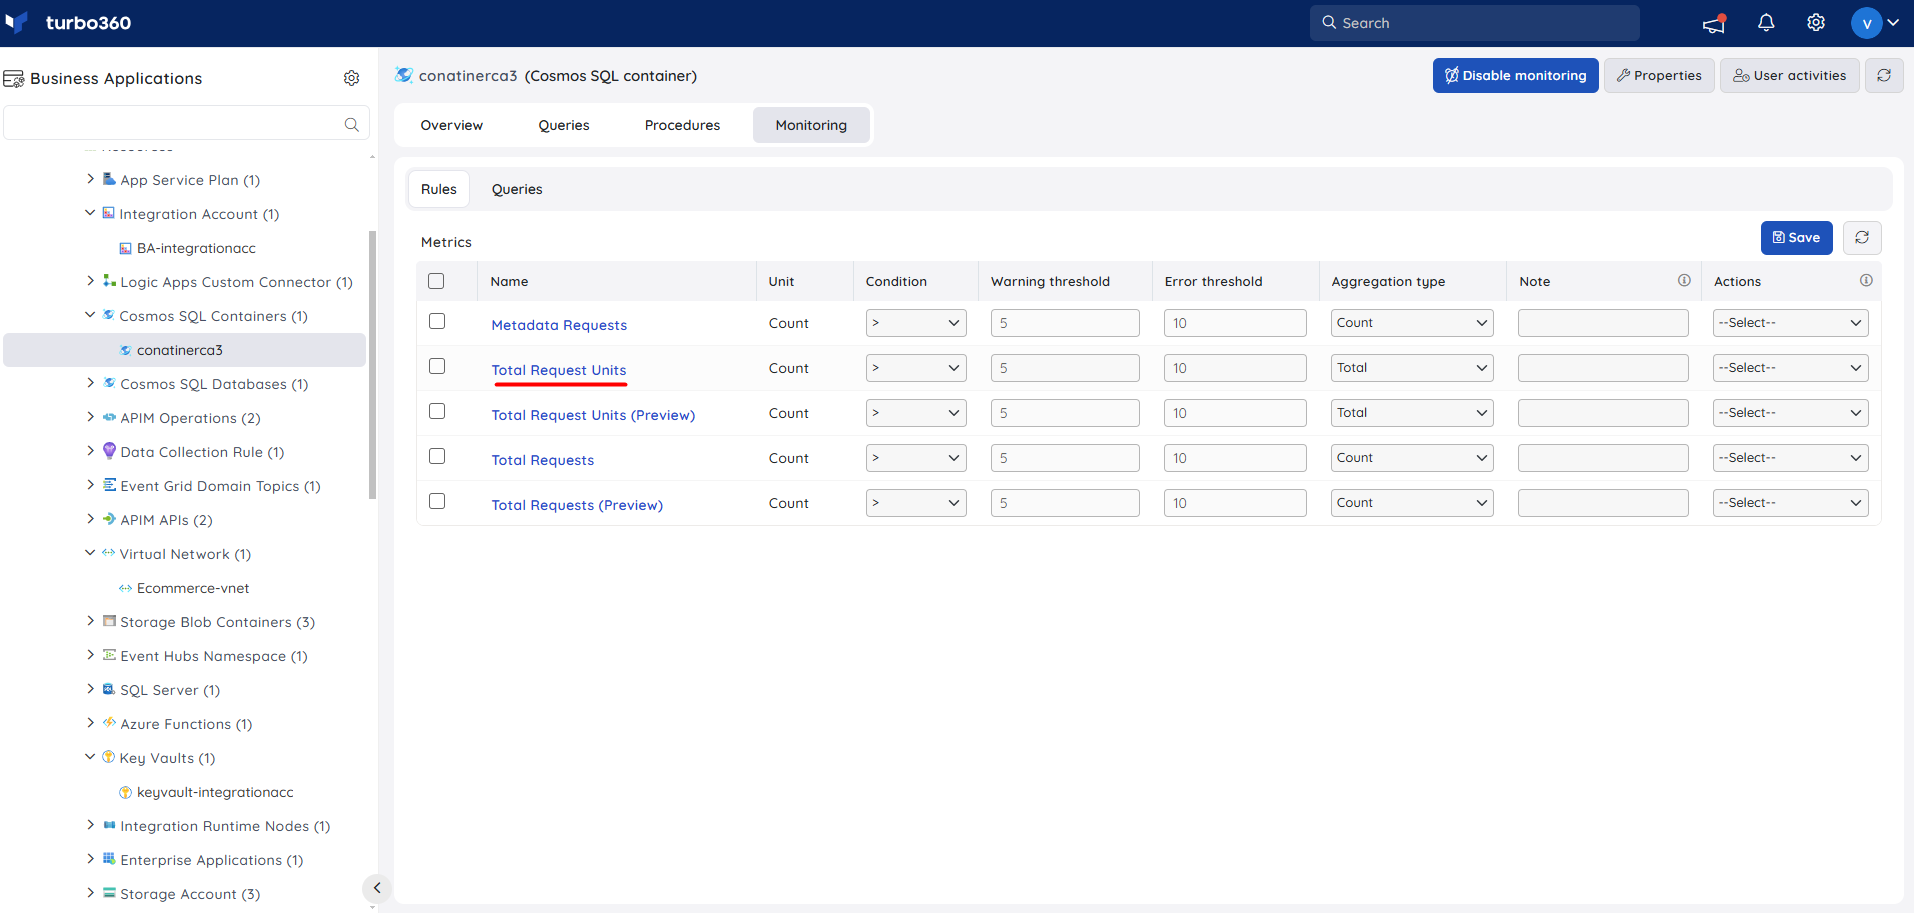
To focus the metric usage on a specific period, use the Settings option to customize the time interval.
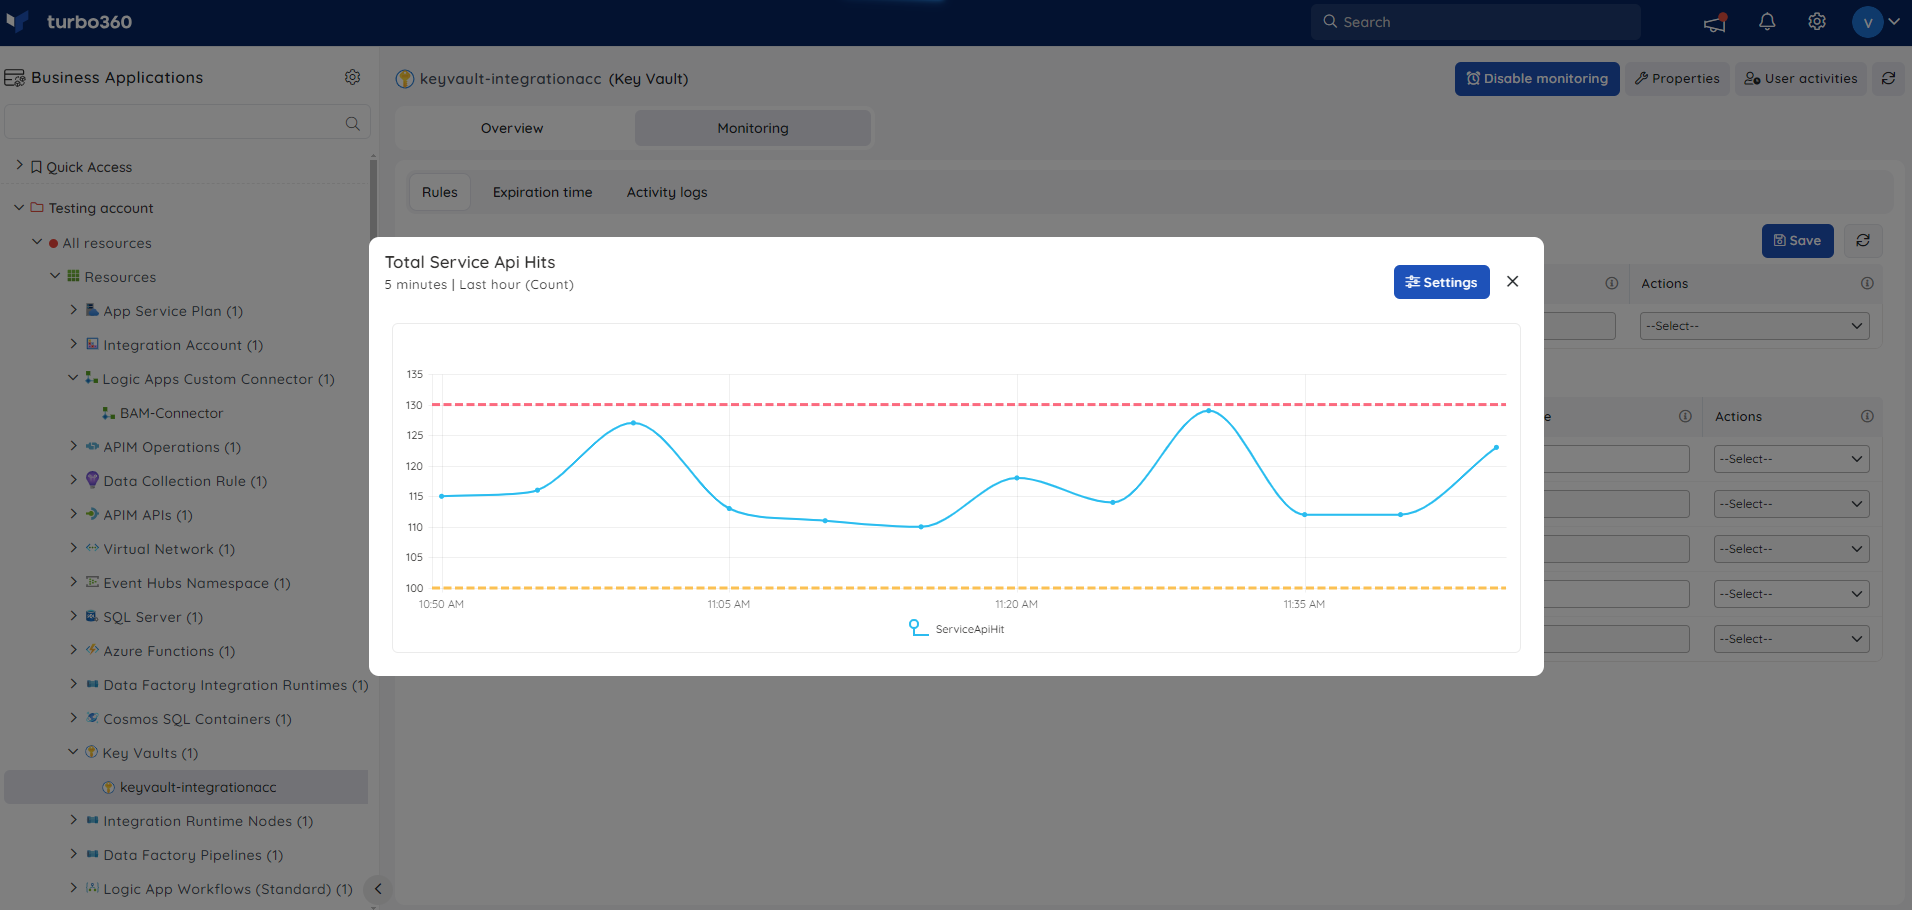
Yellow and red lines represent the warning and error threshold values for the metric. This visualization helps you understand a metric's usage pattern and adjust its threshold values more accurately, so alerts trigger only as usage approaches or exceeds your limits.
This visualization is not available for rules configured through a Monitoring profile.
Explain metric with AI
The Explain with AI option is available for every metric rule across Business Applications. It provides an AI-generated explanation of a selected metric directly in context, so you can make informed decisions about thresholds and aggregation without leaving Turbo360.
To use it, click the sparkle icon ( ✦ ) next to a metric name in the rules configuration panel — available both within an individual resource's Monitoring tab and in the Add monitoring profile or Edit Resource rules panel. This is available for metric rules on any supported resource type.
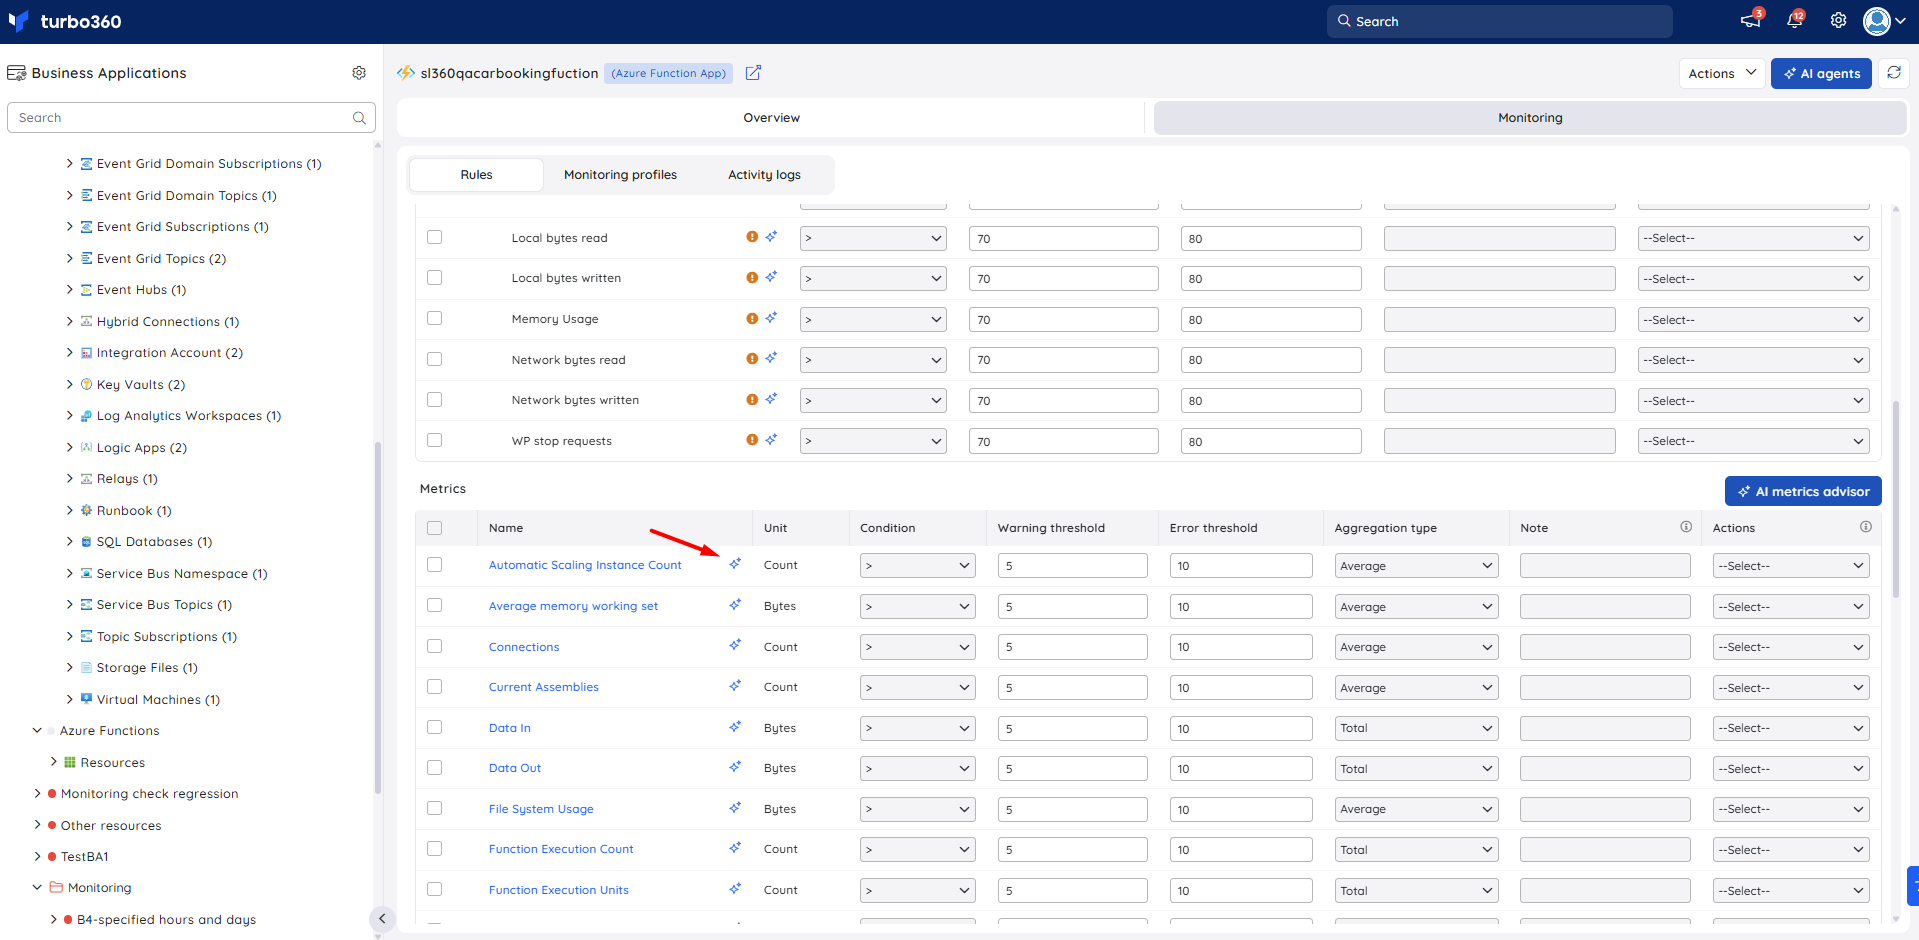
The explanation panel includes:
- Metric overview — what the metric measures, its unit, and its aggregation behavior.
- Why monitor it on this resource — a context-specific explanation based on the resource's current state and region.
- Healthy vs unhealthy range — a visual range indicator showing the suggested warning and error thresholds alongside the current observed baseline.
- Likely causes of a violation — the most common reasons this metric breaches its threshold, with operational context.
- Recommended response on alert — suggested actions to take when this rule is violated.
- Recent behaviour on this resource — a 24-hour chart showing the metric's actual values against the suggested thresholds.
- Suggested thresholds — AI-recommended warning and error threshold values derived from typical values for this resource type.
- Recommended setup — the recommended aggregation type for the metric with a rationale.
- Monitor these together — related metrics worth pairing with this rule to get a fuller picture of the resource's health.
- Common setup pitfalls — aggregation and threshold mistakes to avoid for this specific metric.
Note:
Suggested thresholds are derived from typical values and may show "no activity in the last 24 hours" when a resource has been idle or recently provisioned. Review the current baseline and adjust thresholds to match your expected load before saving.
.png)
Update resource monitoring state
The monitoring state of a resource can be updated from Business Application > Resources > [Resource].
- Enable monitoring enables monitoring for the resource using its configured rules or applied Monitoring profiles.
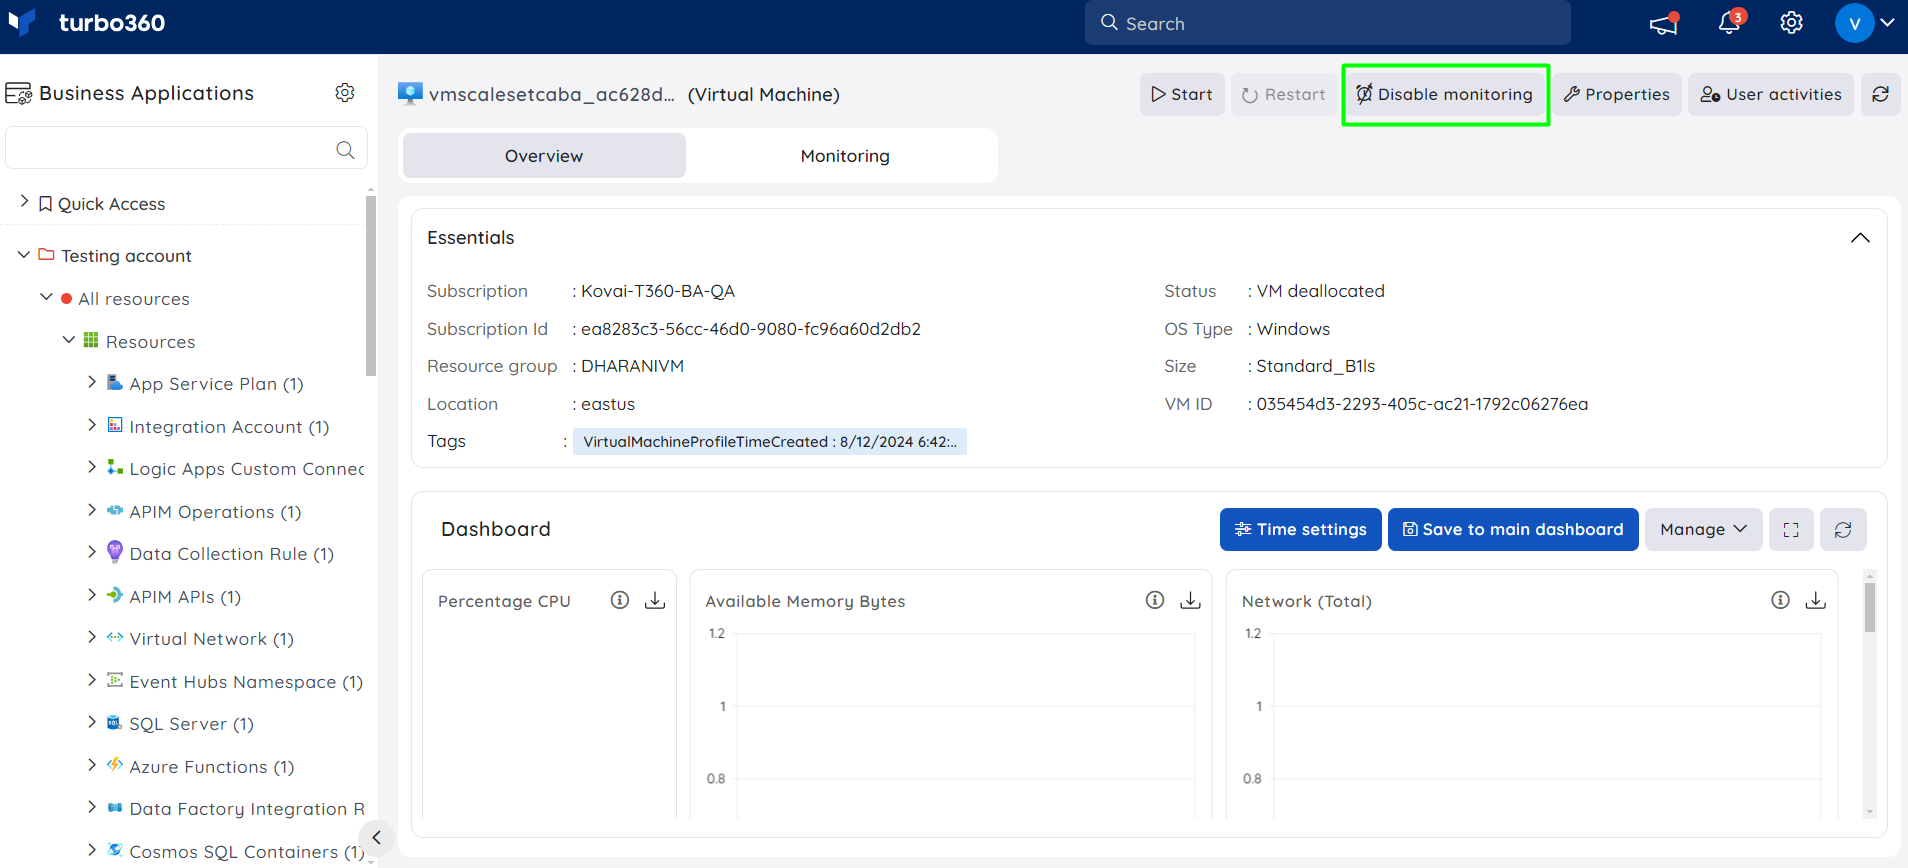
- Disable monitoring completely disables monitoring for the resource, regardless of any rules configured through a Monitoring profile or individual rule configuration.
The image below shows the option to disable monitoring for a Virtual machine resource currently being monitored:
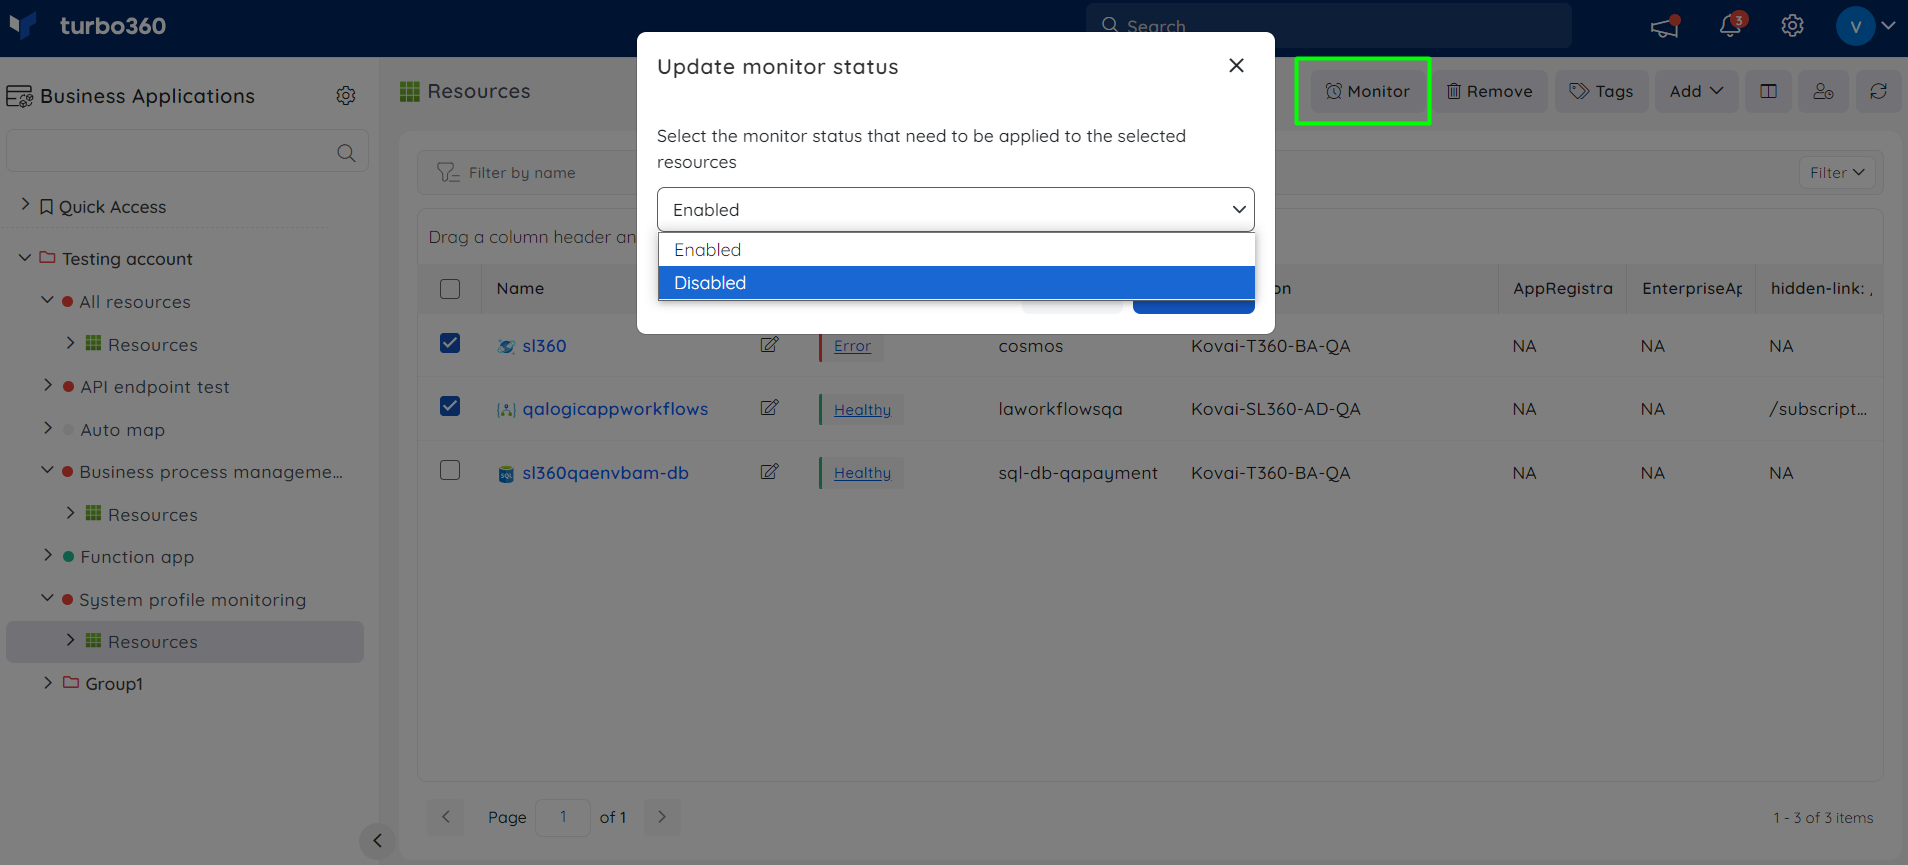
The monitoring state of resources can also be updated for multiple resources at once from Business Application > Resources, regardless of resource type: select multiple resources, click Monitor, choose the required monitoring state, then click Update.
Auto-correct resource status
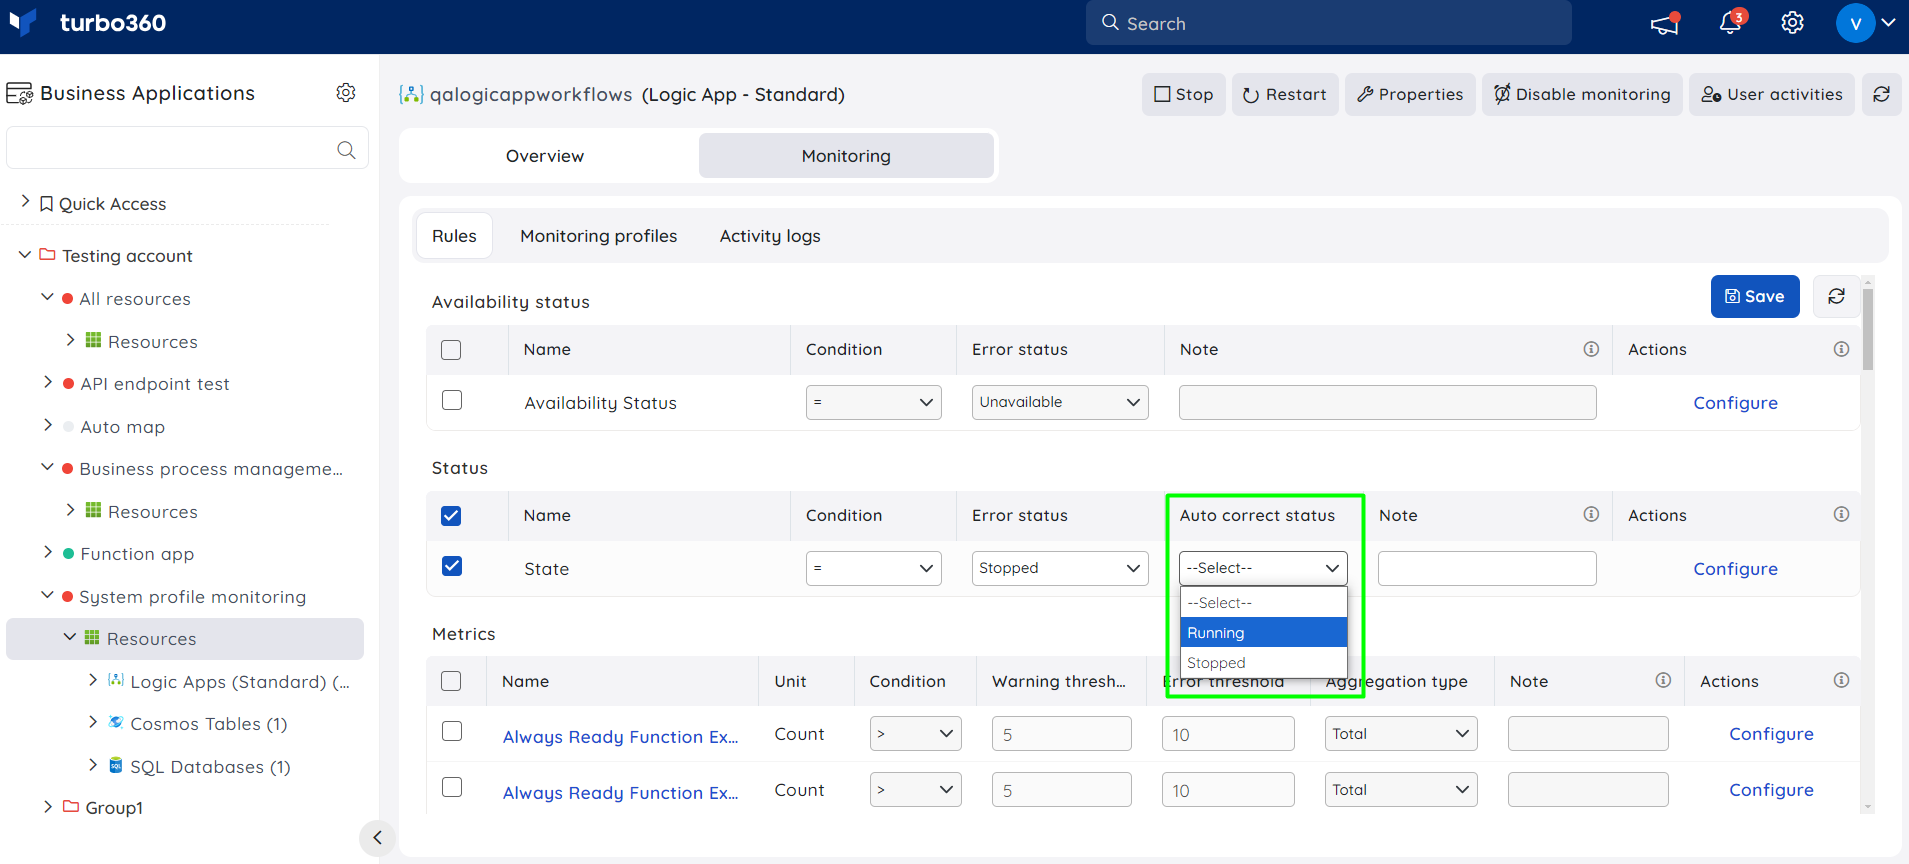
Configure Auto-correct status for a compatible resource from Business Application > Resources > [Resource] > Monitoring > Rules > Auto-correct status, or set it while creating a Business Application.
The image below shows the auto-correct status option for a Logic App (Standard) resource:
The resources that support the Auto-correct status rule include:
- API App
- APIM Product
- Azure Function
- Azure Function App
- Databricks Compute Cluster
- Databricks Delta Live Table
- Event Hub
- Logic App
- Logic App - Standard
- Logic App Workflow Standard
- Service Bus Queue
- Service Bus Topic
- Service Bus Topic Subscription
- Virtual Machine
- Web App
- Web Job
When Auto-correct status is configured with an appropriate value, the correction runs using that value at the specified monitoring interval whenever an error status is detected. The auto-corrected information appears alongside the alert details sent through your configured notification channels.
The image below shows the auto-corrected information for a Logic App (Standard) resource, received through Turbo360 mail:
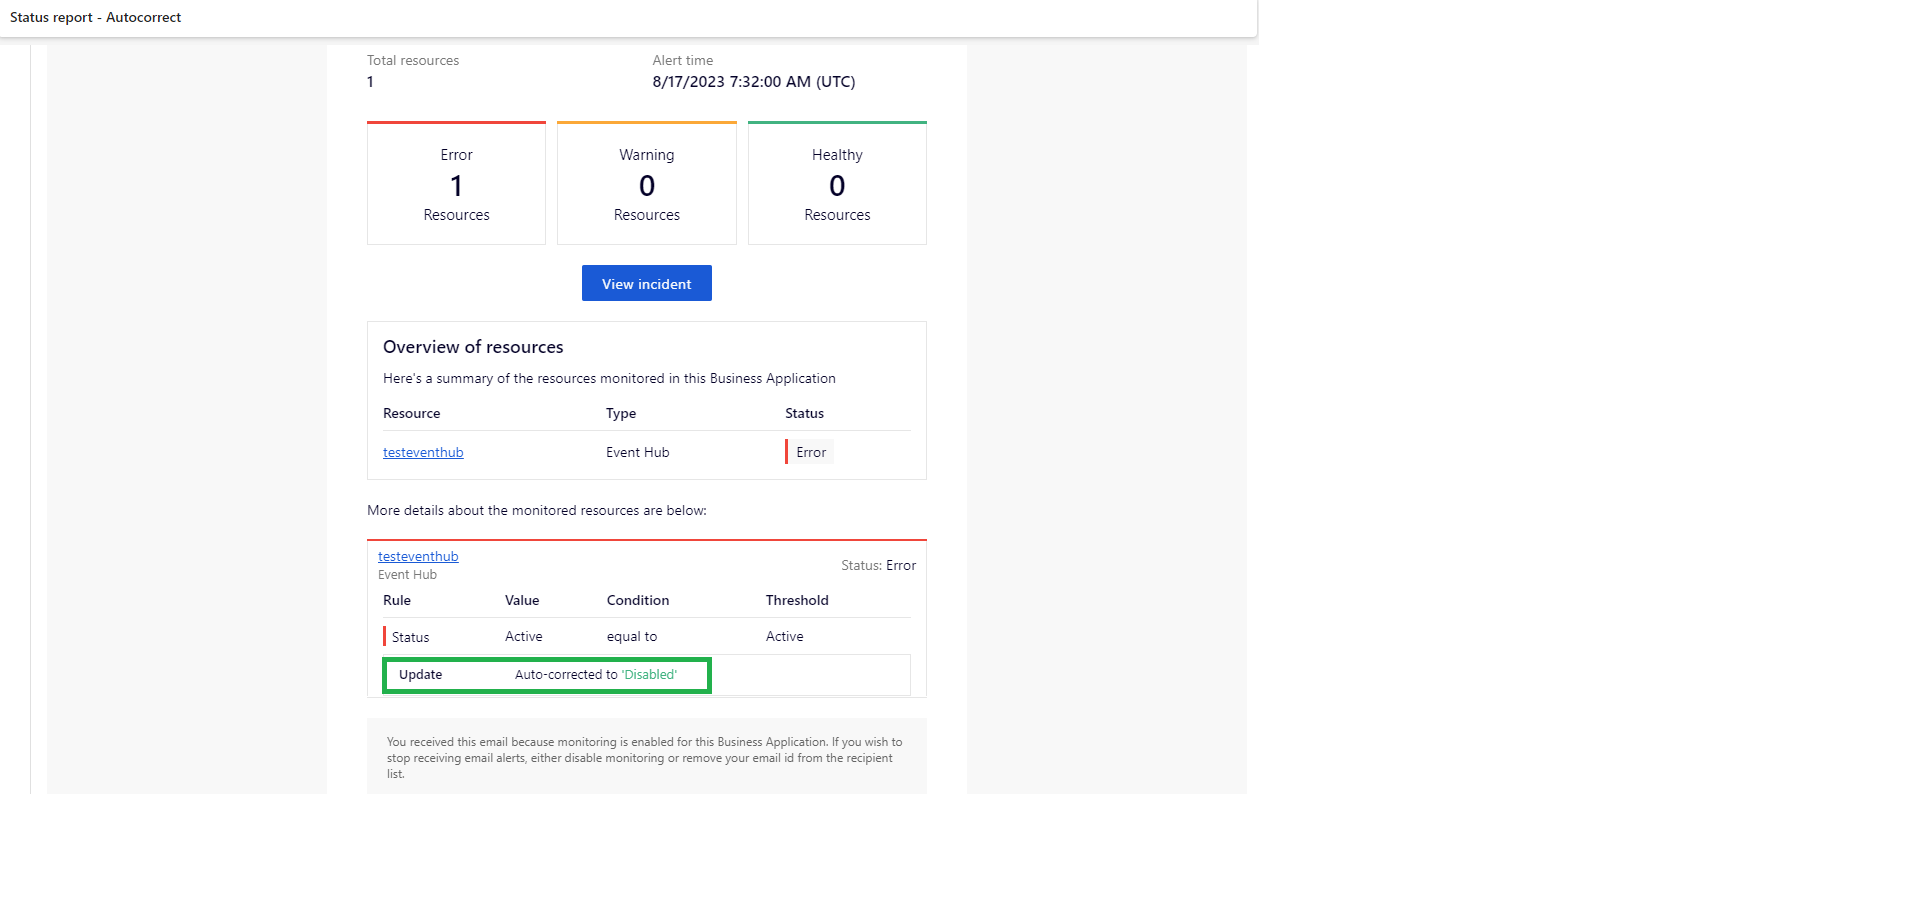
Auto-corrected information is not displayed in the Business Application Alert history.
Automated tasks triggered by rule violation
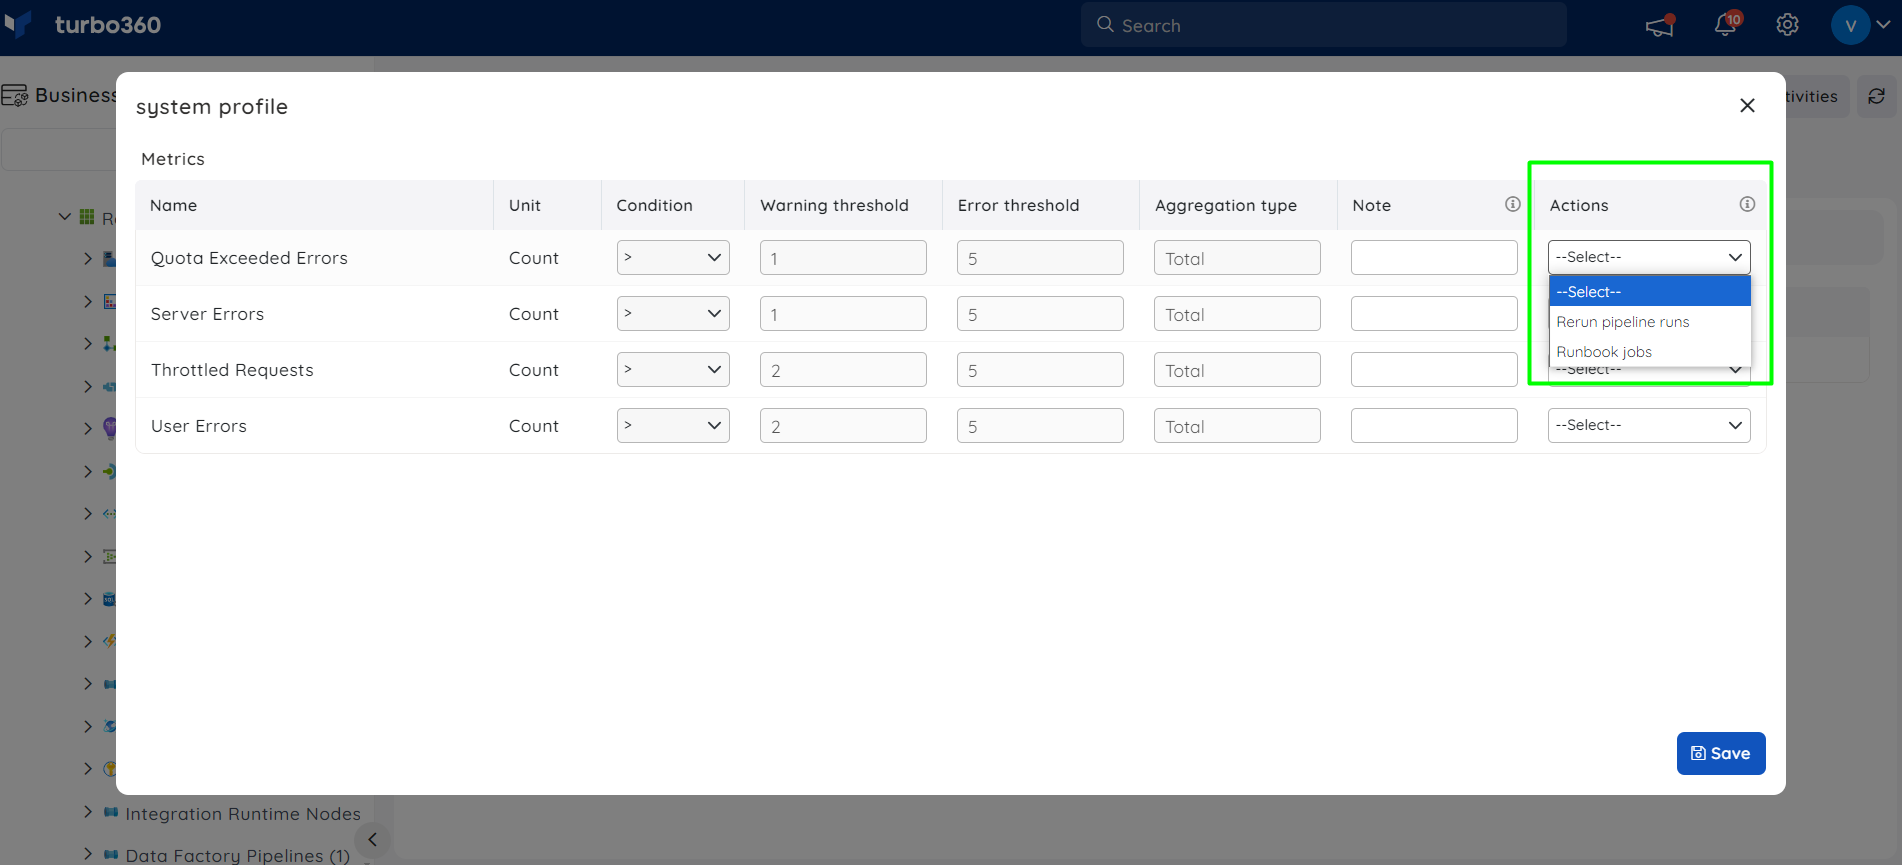
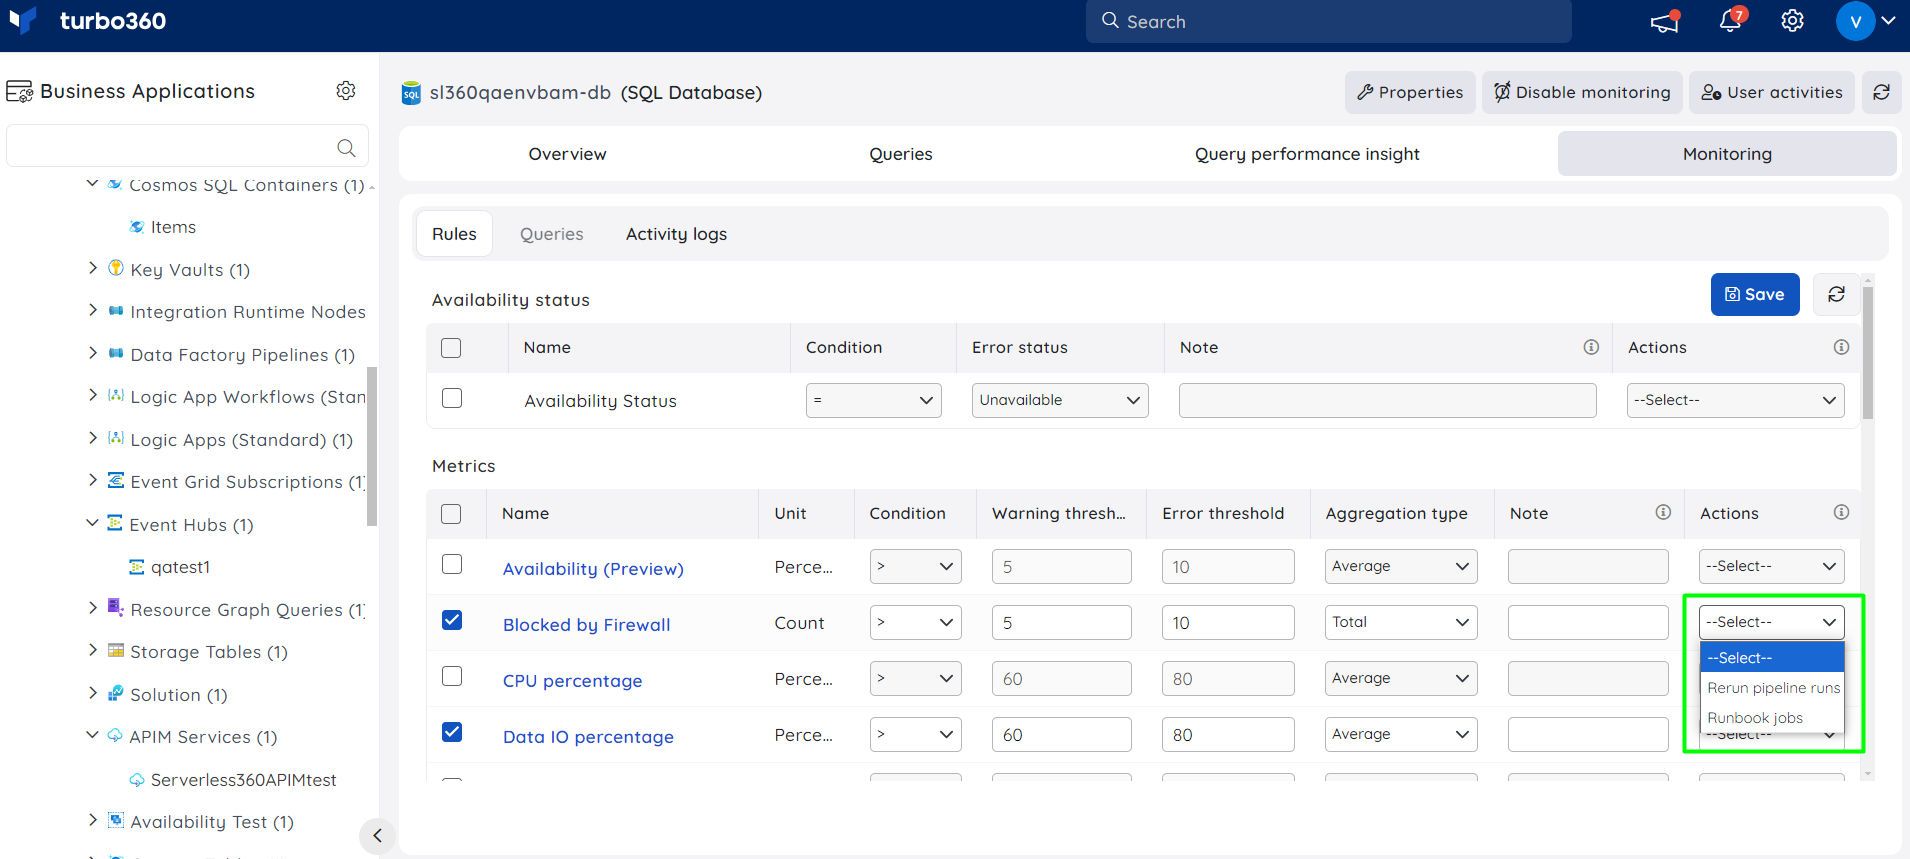
You can configure an Automated task to run once a resource metric is violated during monitoring, from Settings > Monitoring settings > Monitoring profiles > [Profile] > [Resource] at the profile level, or from Business Application > Resources > [Resource] > Monitoring at the resource level.
The image below shows a profile-level task configured for a rule violation:
The image below shows a resource-level task configured for a rule violation:
This setting does not affect scheduled automated tasks, regardless of their configuration for any monitoring rule violation. A task configured for an existing metric violation runs again only when that rule is violated again — it ignores any other resource rule violations occurring alongside it.
An automated task configured for a metric violation does not run if the metric is in a warning state.
Resolution notes
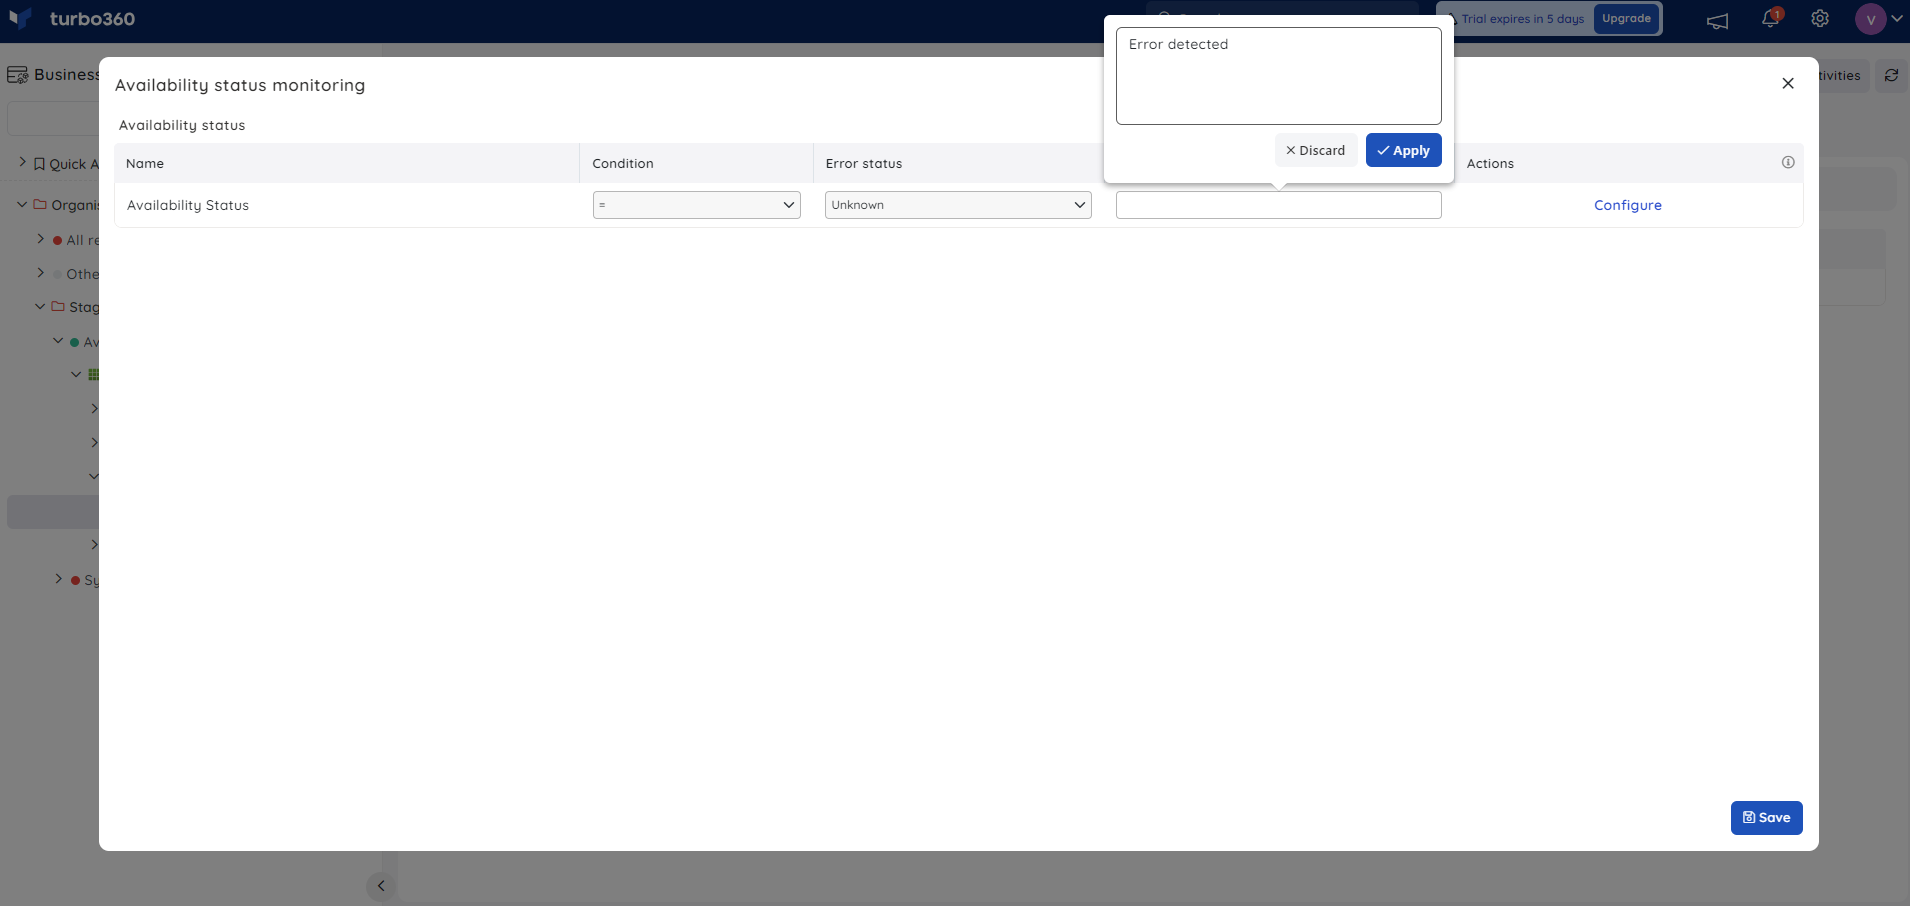
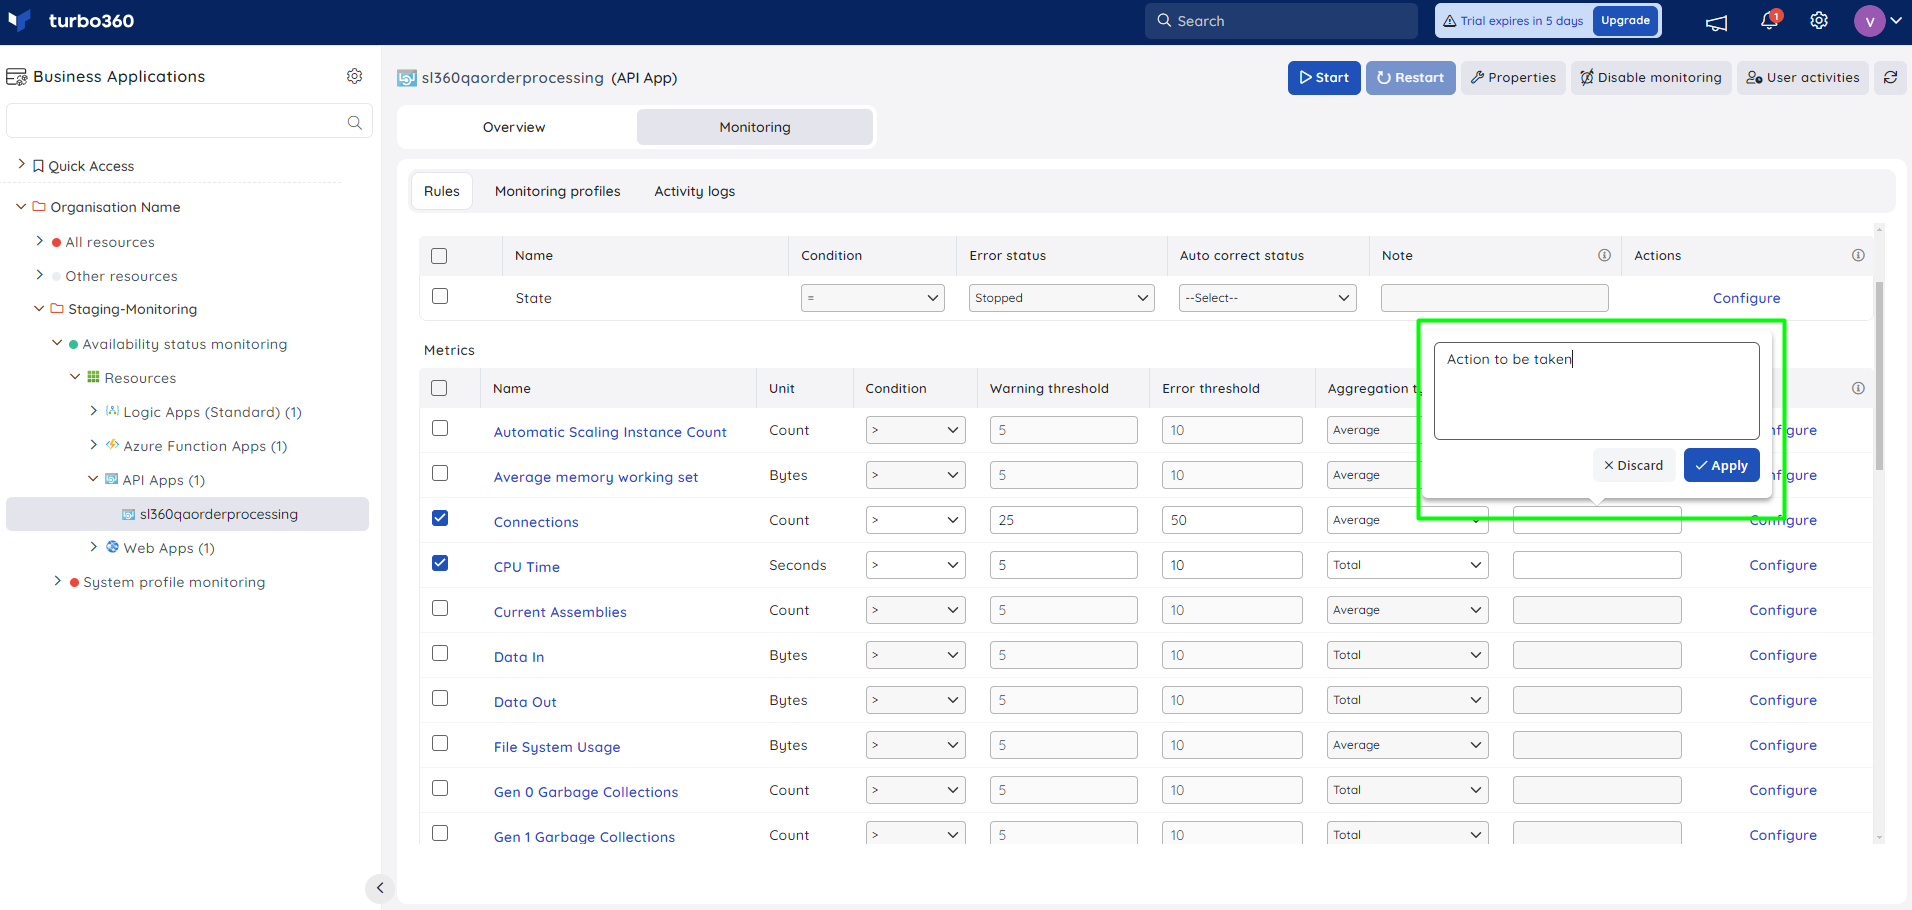
A resolution note is a brief description you provide for a rule violation, configurable from Settings > Monitoring settings > Monitoring profiles > [Profile] > [Resource] at the profile level, or from Business Application > Resources > [Resource] > Monitoring at the resource level. The note is sent with the rule violation alert to your configured channels.
A resolution note added at the profile level affects every Business Application the profile is applied to, both at the profile level and the resource level.
The image below shows how to configure a resolution note at the profile level:
You can also update resolution notes at the resource level, where resource-level alerts include the note alongside the violation details.
The image below shows how to configure a resolution note at the resource level:
Example scenario
A support engineer configures a Metric rule on a Function App's execution count, setting both a Warning and an Error threshold. They select the Average aggregation type to smooth out short spikes, then enable Auto-correct status to restart the resource automatically once it enters an error state. They also configure an Automated task to send a Teams notification when the rule is violated, and add a resolution note documenting the known cause for on-call reference.
Troubleshooting
Metric chart is not visible for a resource
Cause: The rule is configured through a Monitoring profile rather than at the resource level.
Fix: Configure the rule directly at the resource level to enable metric visualization.Auto-correct status is not applied to a resource
Cause: The resource type is not on the supported list, or the violation has only reached the warning threshold rather than the error threshold.
Fix: Confirm the resource type supports Auto-correct status and that the rule has reached its error threshold.A rule does not trigger despite the metric exceeding its expected value
Cause: The selected aggregation type doesn't reflect the actual usage pattern over the configured period.
Fix: Review and adjust the aggregation type for the metric to match how you expect it to be evaluated.An automated task does not run after a metric violation
Cause: The metric is in a warning state rather than an error state.
Fix: Confirm the rule has reached its error threshold before expecting the automated task to run.
Related articles
Was this article helpful?