

Resource dashboards
- 05 Aug 2026
- 4 Minutes to read
- Print
- DarkLight
- Download PDF
Resource dashboards
- Updated on 05 Aug 2026
- 4 Minutes to read
- Print
- DarkLight
- Download PDF
Article summary
Did you find this summary helpful?
Thank you for your feedback!
Overview
A resource dashboard is a pre-built dashboard available within each Azure resource tracked in a Business Application. It gives you isolated visibility into that resource's metrics and operational data without needing to build a dashboard from scratch. Resource dashboards are available for all compatible resource types, and the widget library for each one is pre-populated with the most relevant metrics for that resource.
Business value
Resource dashboards let you assess the health of individual Azure resources directly within Turbo360, without switching to the Azure portal. Pre-built widgets reduce the setup time required for resource-level monitoring, and the ability to save resource dashboard widgets to the main Business Application dashboard means your most important resource signals can surface at the application level.
How it works
Each resource dashboard has two tabs in the Overview section: the Dashboard tab showing pre-configured and custom widgets, and the Metrics tab for ad-hoc metric queries. They use the same widget engine as Business Application dashboards — supporting the same six chart types, time settings, zoom, full-screen mode, and download capabilities. For resources with no default widget configuration, a blank dashboard is available for you to customise.
Permissions
Resource dashboard access is controlled by the Dashboard feature permission and the resource-level permission assigned in your role.
| Access level | What you can do |
|---|---|
| Resource-level Read + Dashboard Read | View resource dashboard widgets |
| Resource-level Manage + Dashboard Read | Add, edit, and delete resource dashboard widgets |
| Resource-level Manage + Dashboard Manage | Add, edit, and delete resource dashboard widgets; save resource dashboards to the main Business Application dashboard |
Compatible resource types
Resource dashboards with pre-configured widgets are available for the following resource types:
| Azure service | Resource types |
|---|---|
| API Management | APIM Service, APIM API, APIM Operation, APIM Product |
| App Service | API app, Web App |
| Azure Functions | Azure Function App |
| Cosmos DB | Cosmos SQL Container, Cosmos SQL Database, Cosmos Table |
| Data Factory | Data Factory, Data Factory Pipeline, Data Factory Integration Runtime |
| Event Grid | Event Grid Subscription, Event Grid Topic, Event Grid Domain, Event Grid Domain Subscription, Event Grid Domain Topic |
| Event Hub | Event Hub |
| Hybrid Connections | Hybrid Connection, Relay |
| Log Analytics | Log Analytics Workspace |
| Logic Apps | Logic App, Logic App (Standard) |
| Monitoring | Application Insight |
| Service Bus | Service Bus Queue, Service Bus Topic |
| SQL | SQL Database, SQL Elastic Pool |
| Virtual Machines | Virtual Machine |
Note:
Resource dashboards are also available for additionally supported resource types, but no widgets are pre-configured. You can personalise the blank dashboard to suit your needs.
To access a resource dashboard, select the resource in the tree view and navigate to the Overview tab.
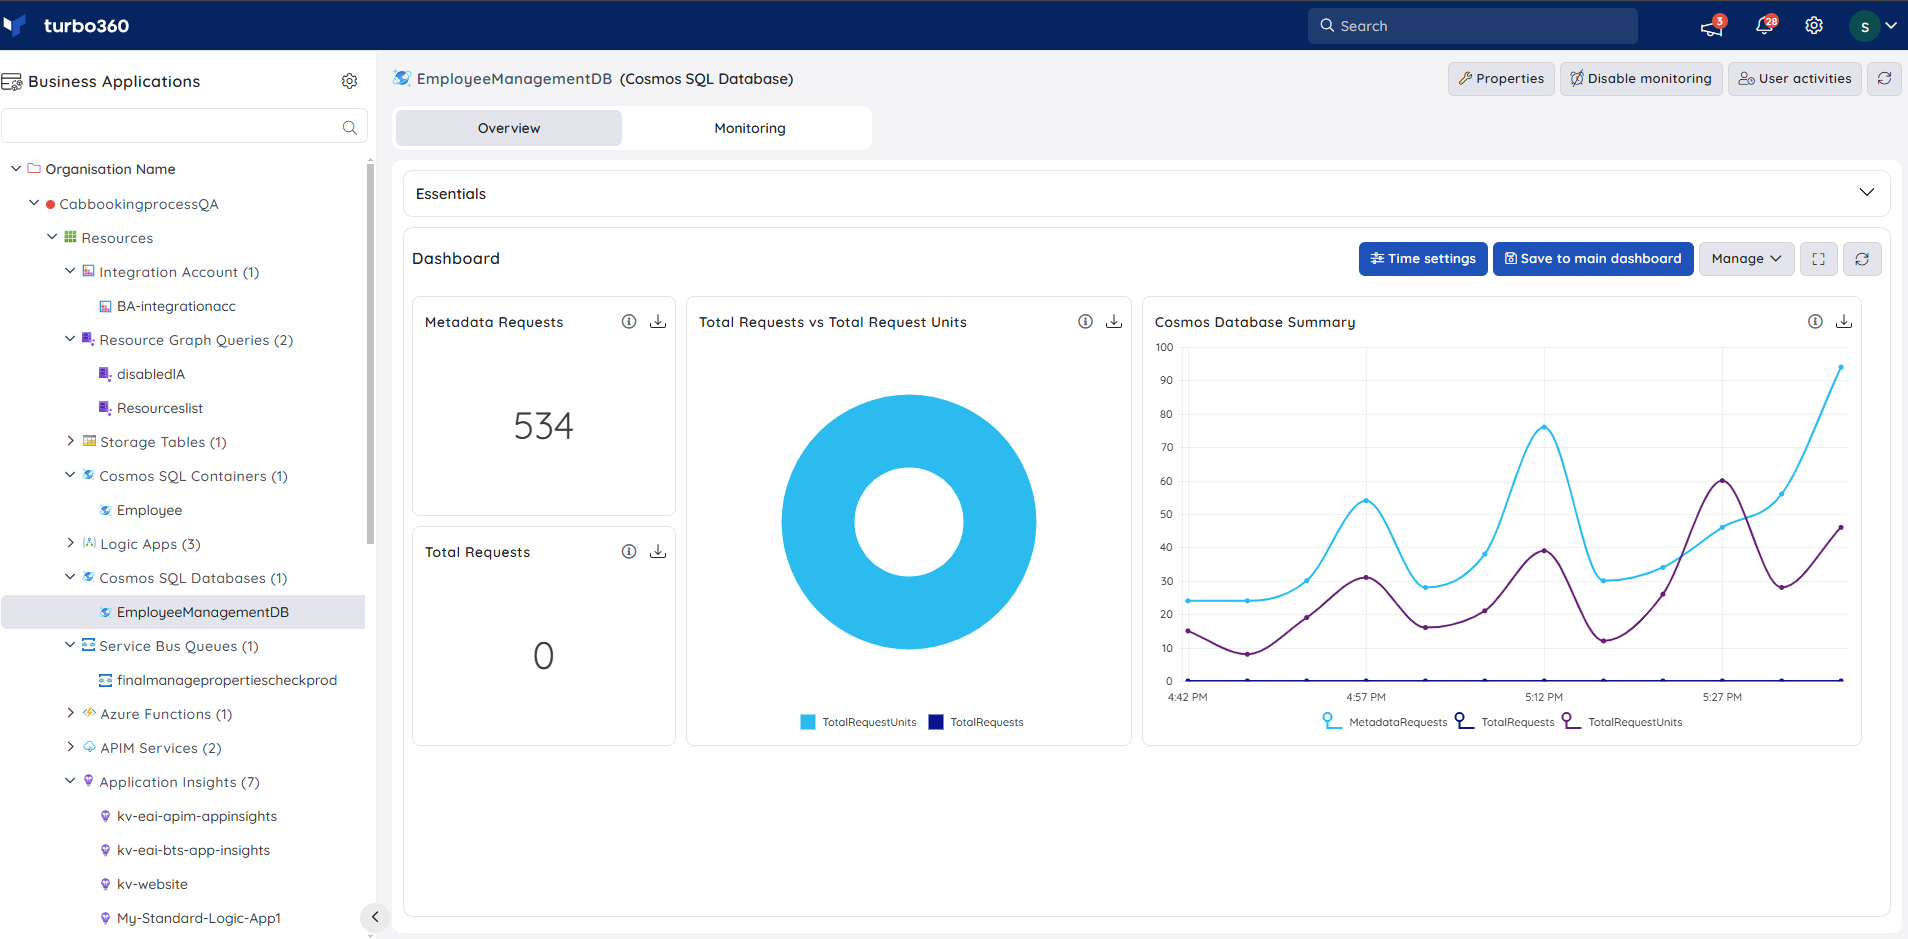
Chart types
Resource dashboards support the same six chart types as Business Application dashboards. See Business Application dashboard for full chart type descriptions and screenshots.
| Chart type | What it displays |
|---|---|
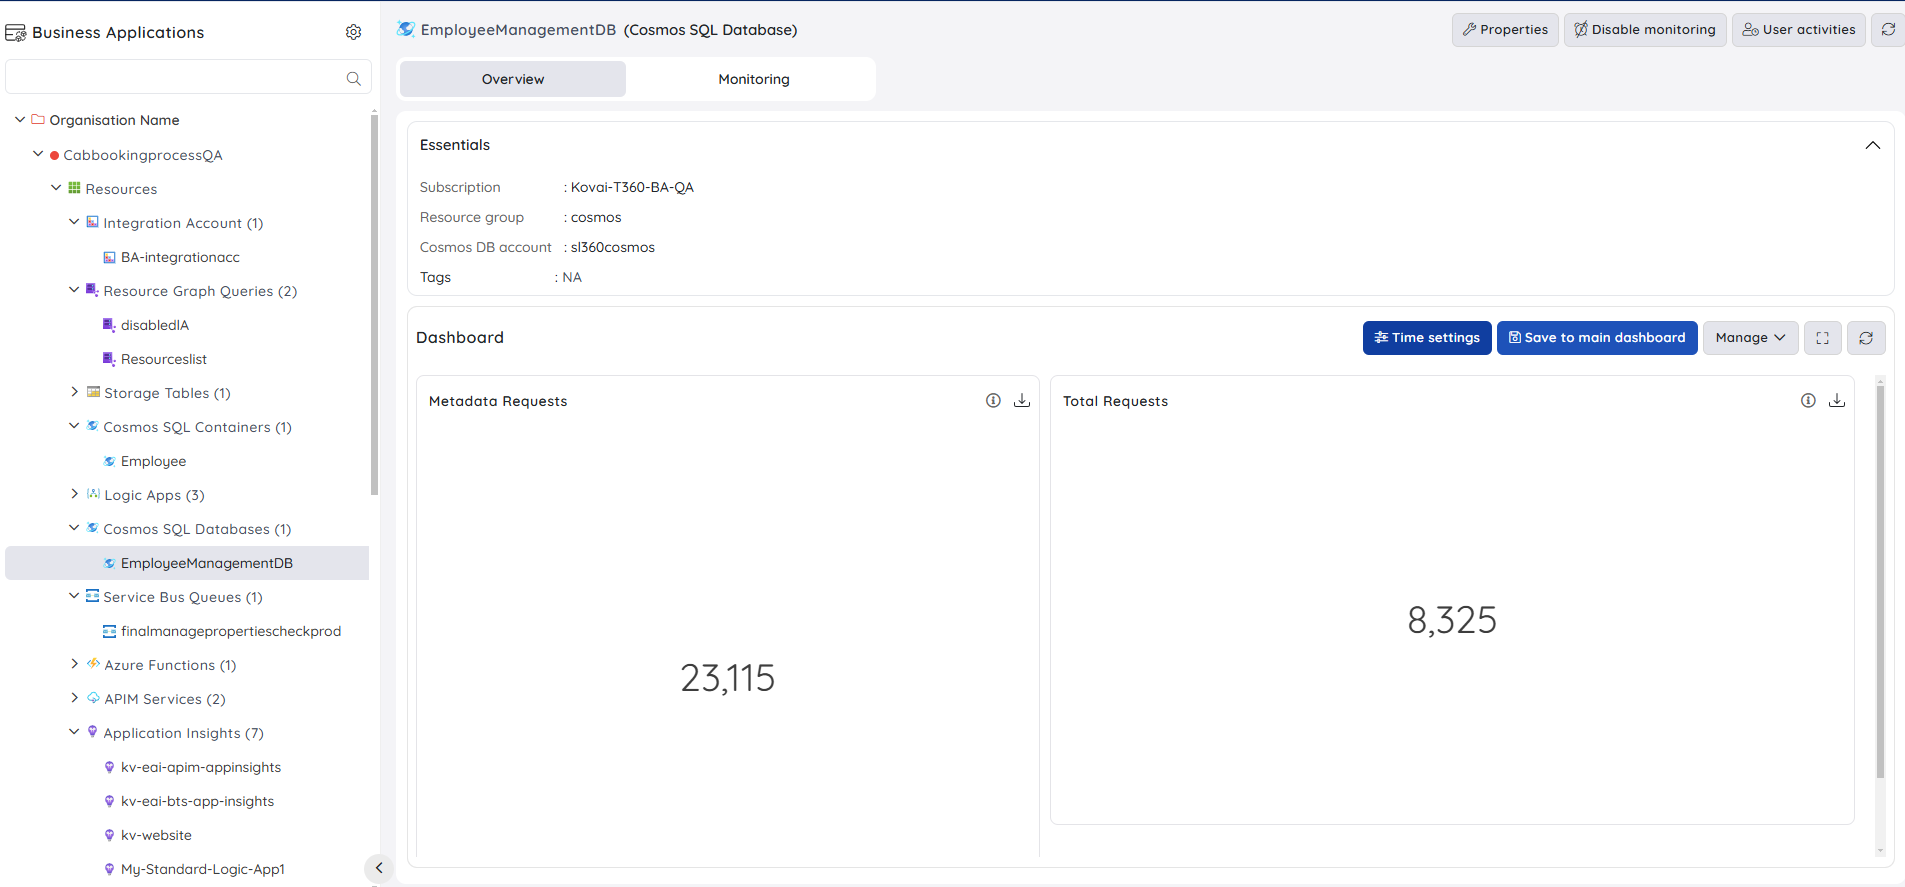
| Count chart | A single cumulated value at a given time frame |
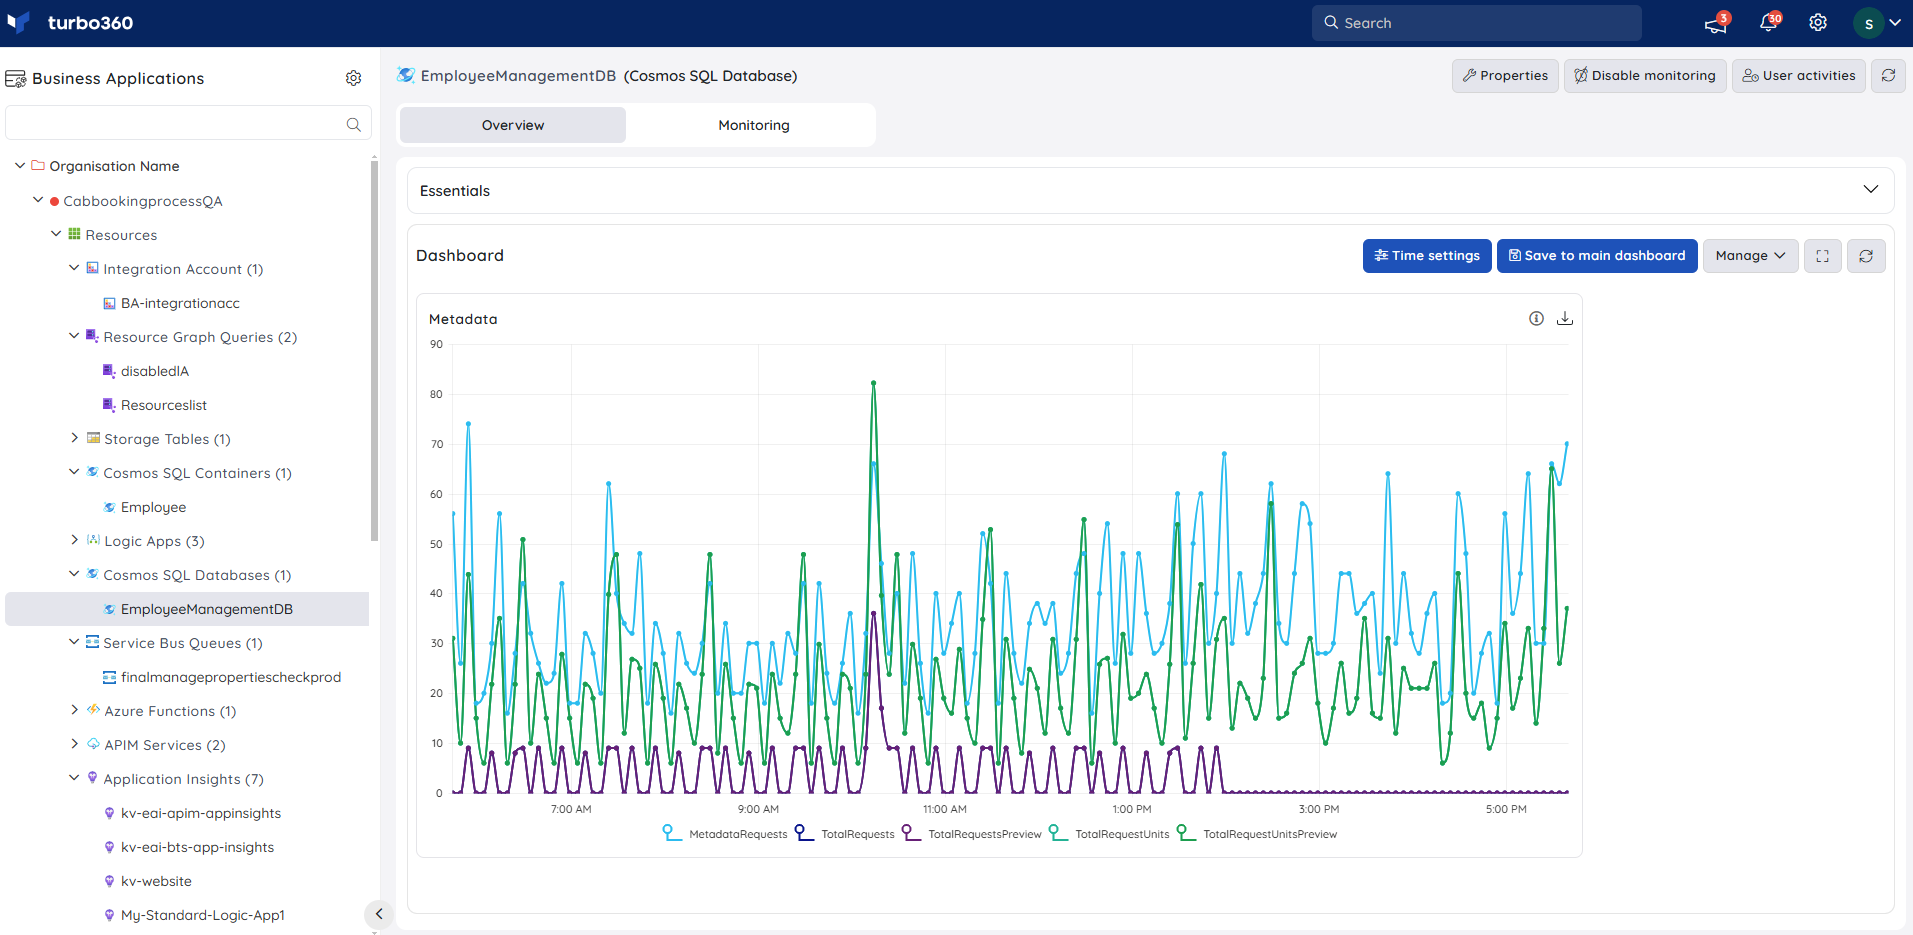
| Line chart | Multi-time-series trend with date/time on the X-axis |
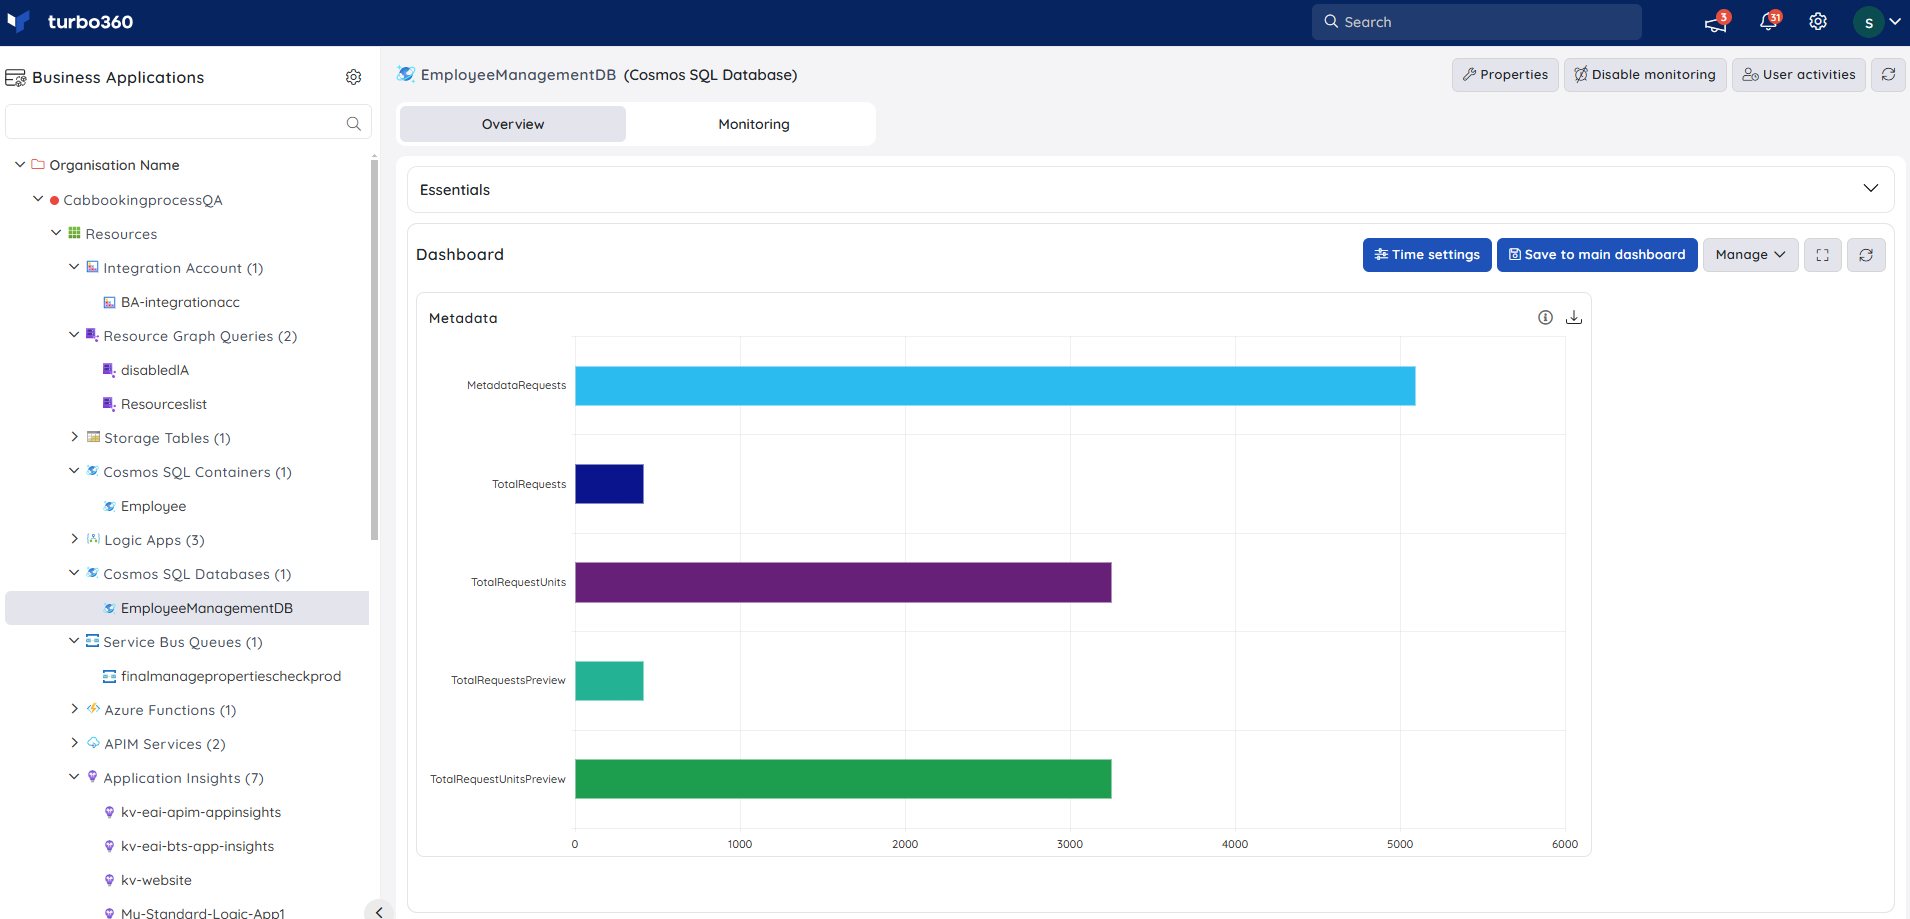
| Bar chart | Multi-time-series comparison with metrics or resources on the Y-axis |
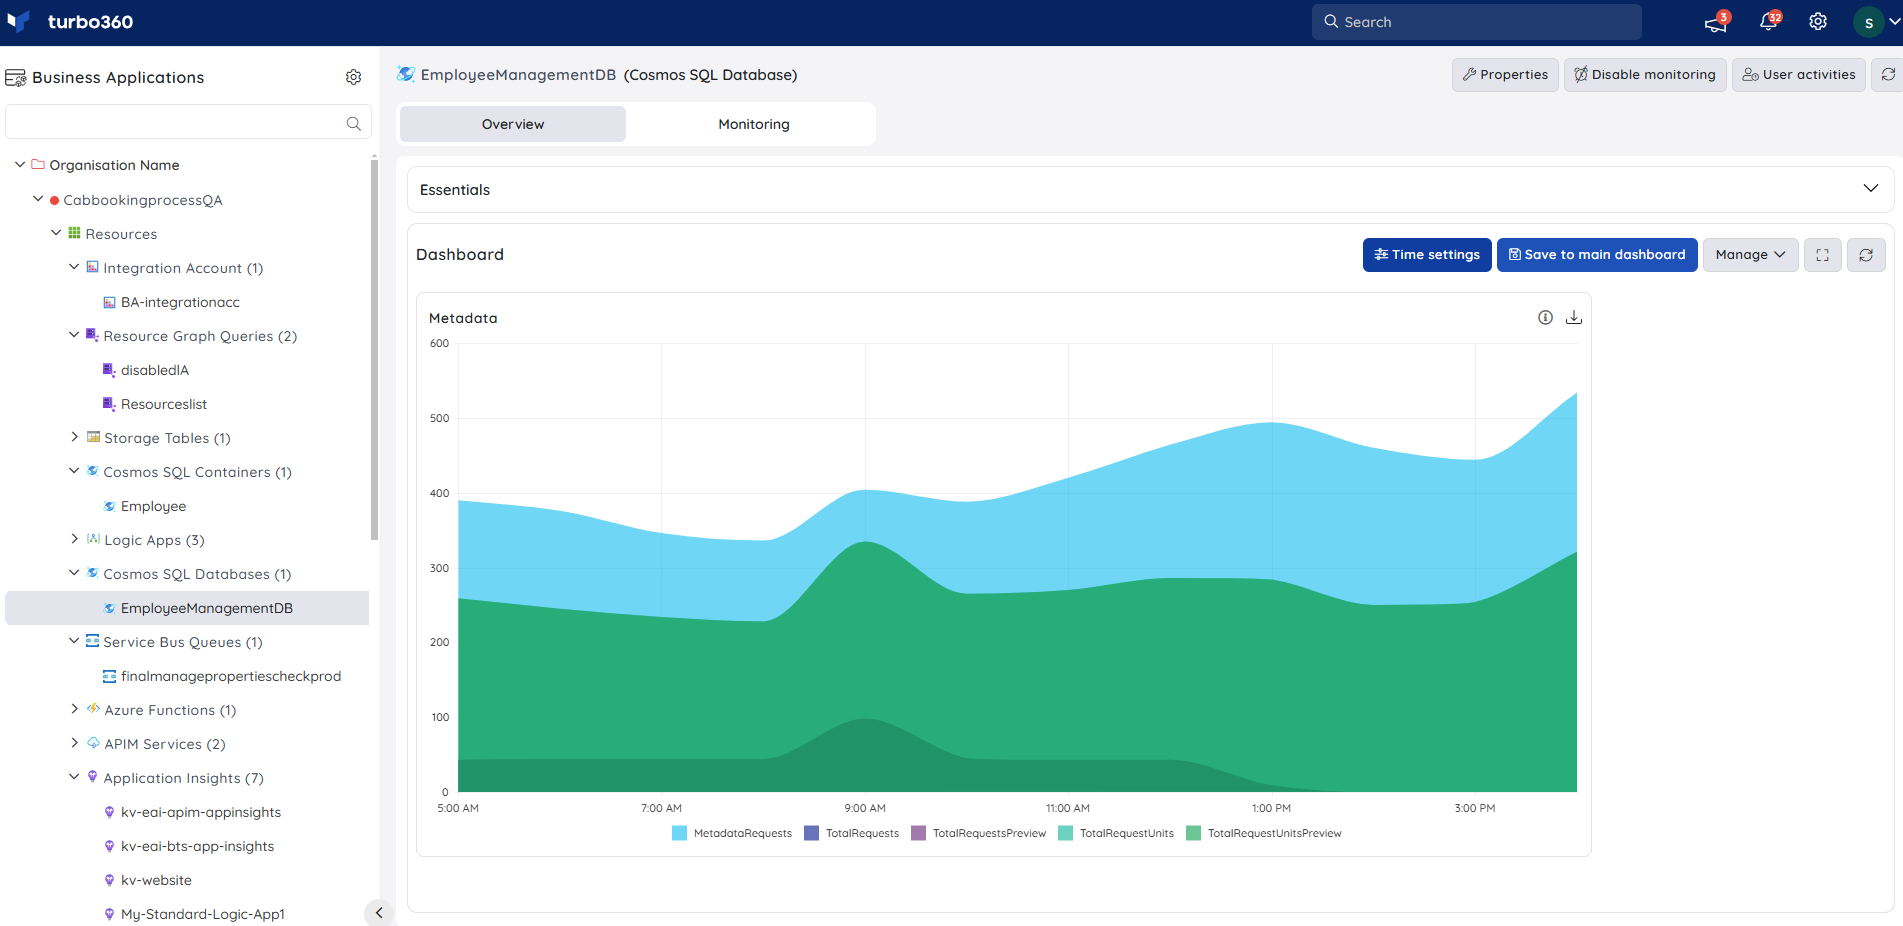
| Area chart | Multi-time-series with filled area below the line |
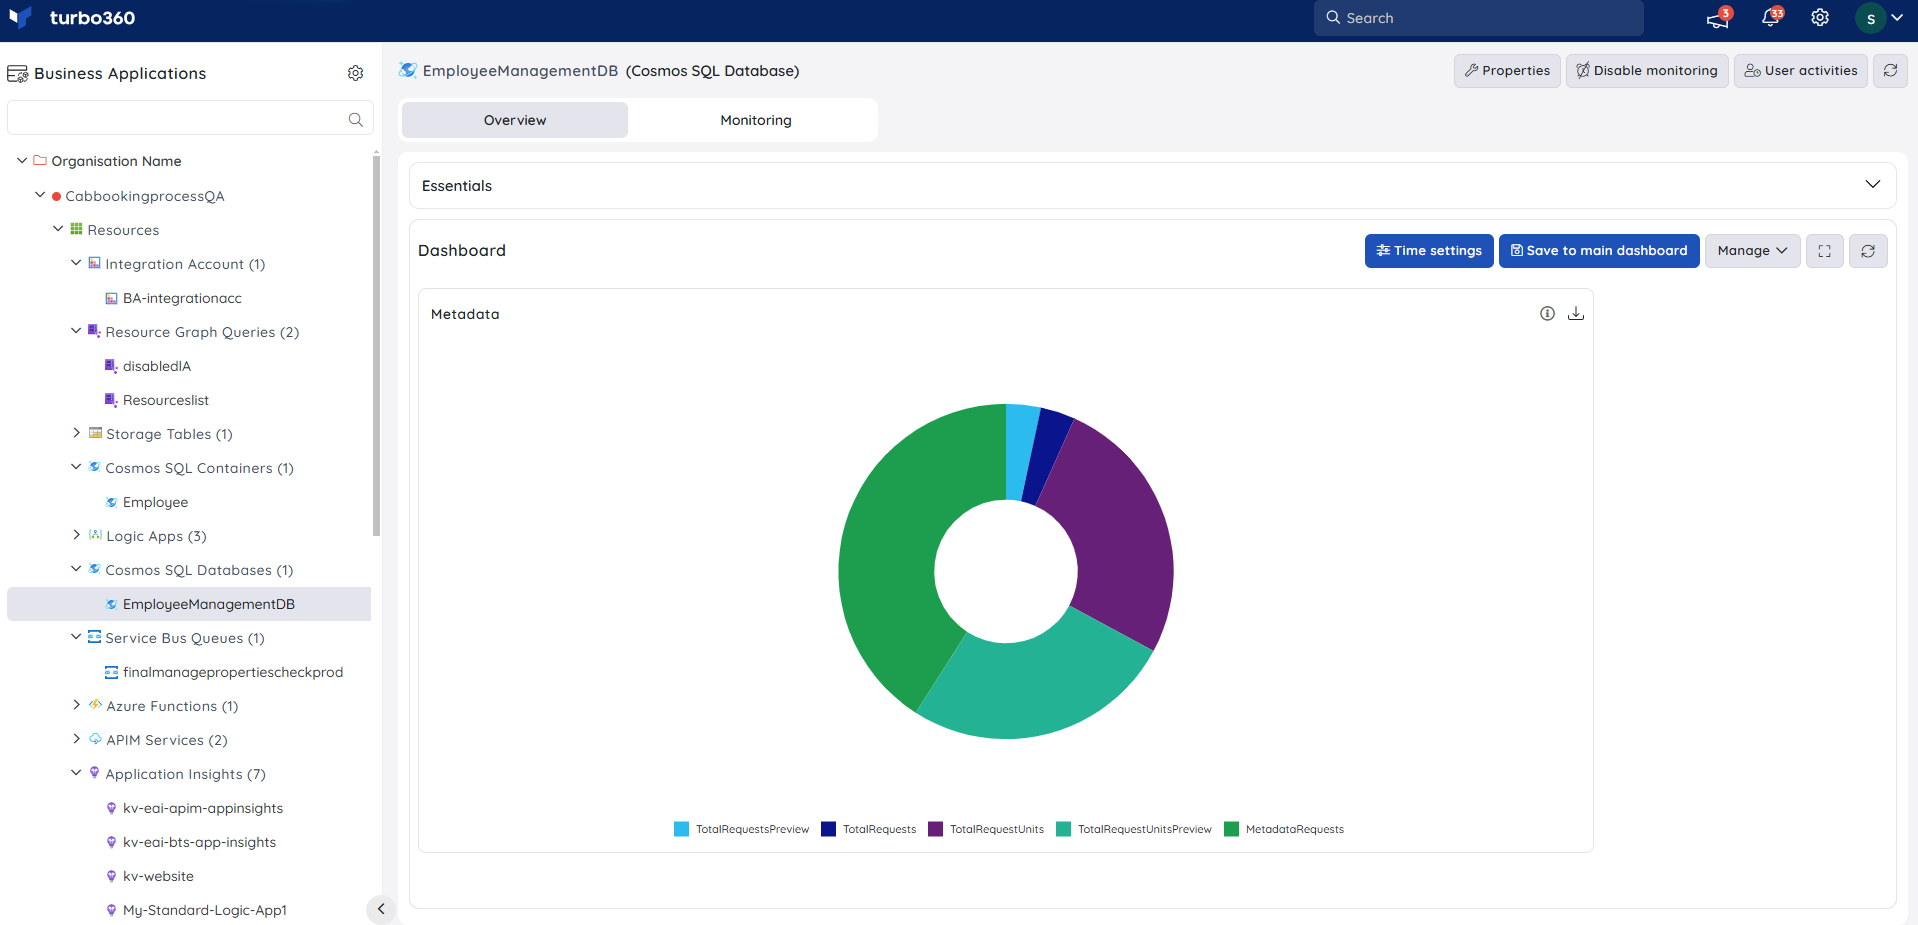
| Pie chart | Proportional slices for resource or metric distribution |
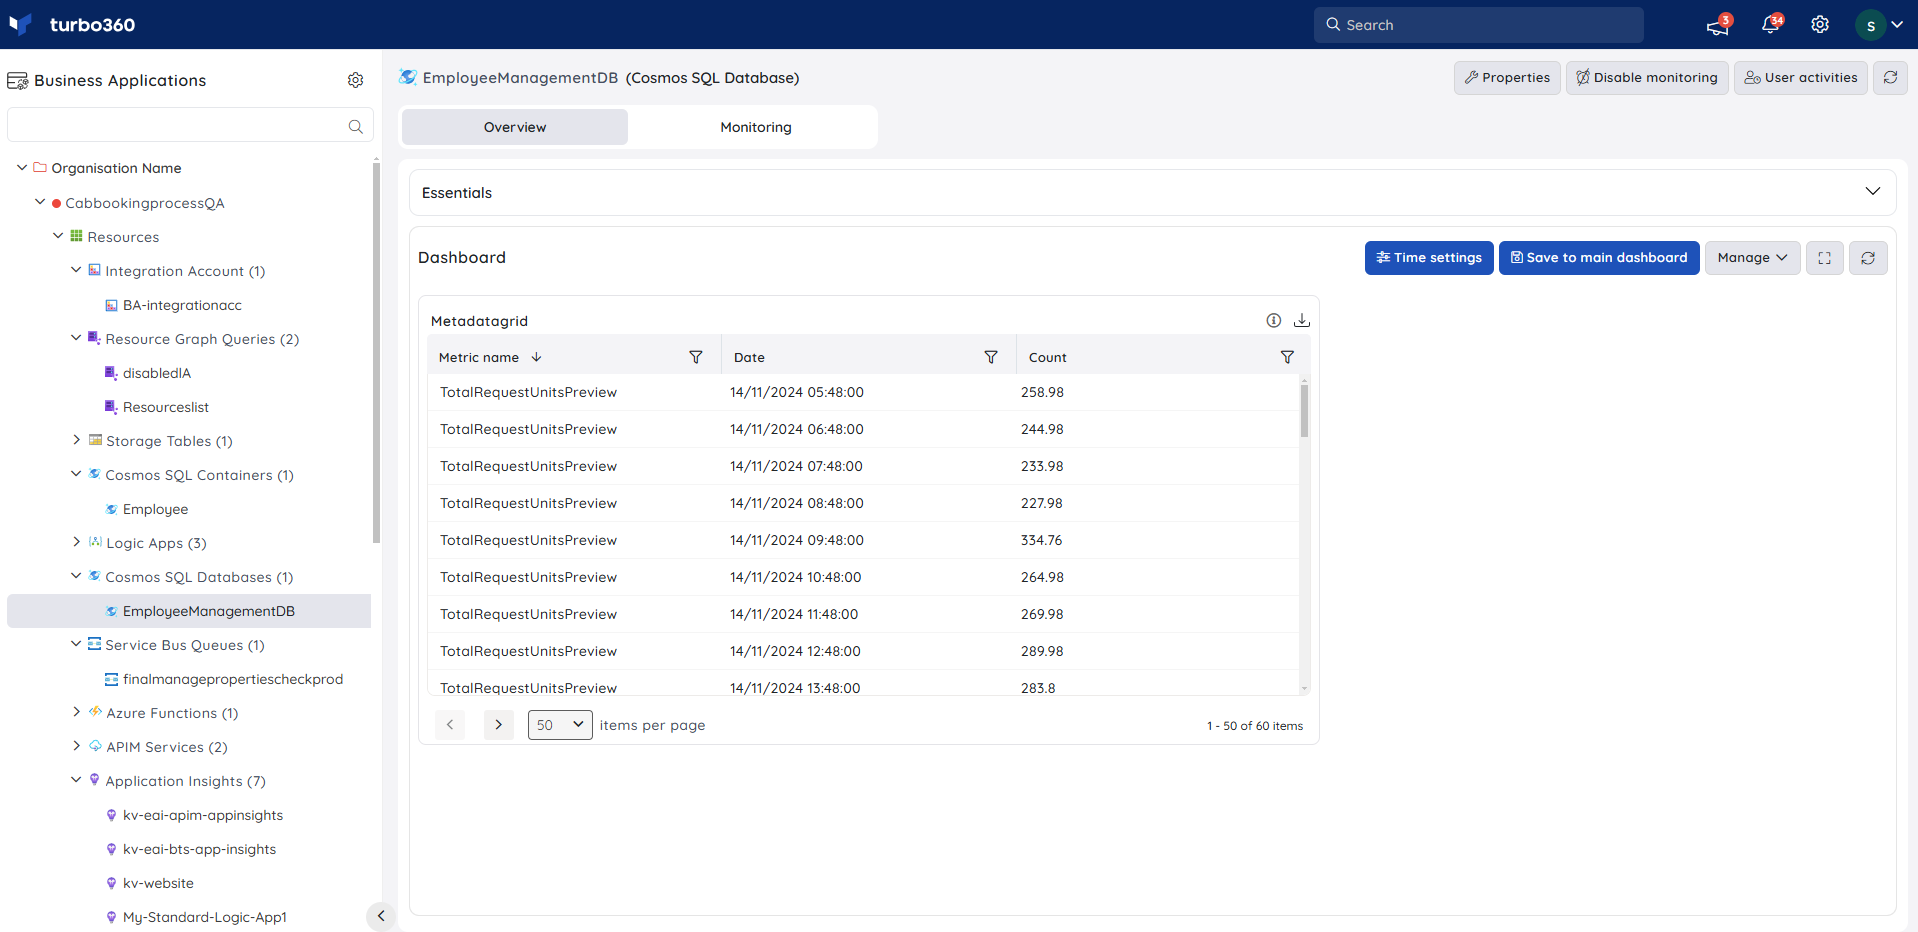
| Grid | Real-time data in a filterable table format |
Count chart
Line chart
Bar chart
Area chart
Pie chart
Grid
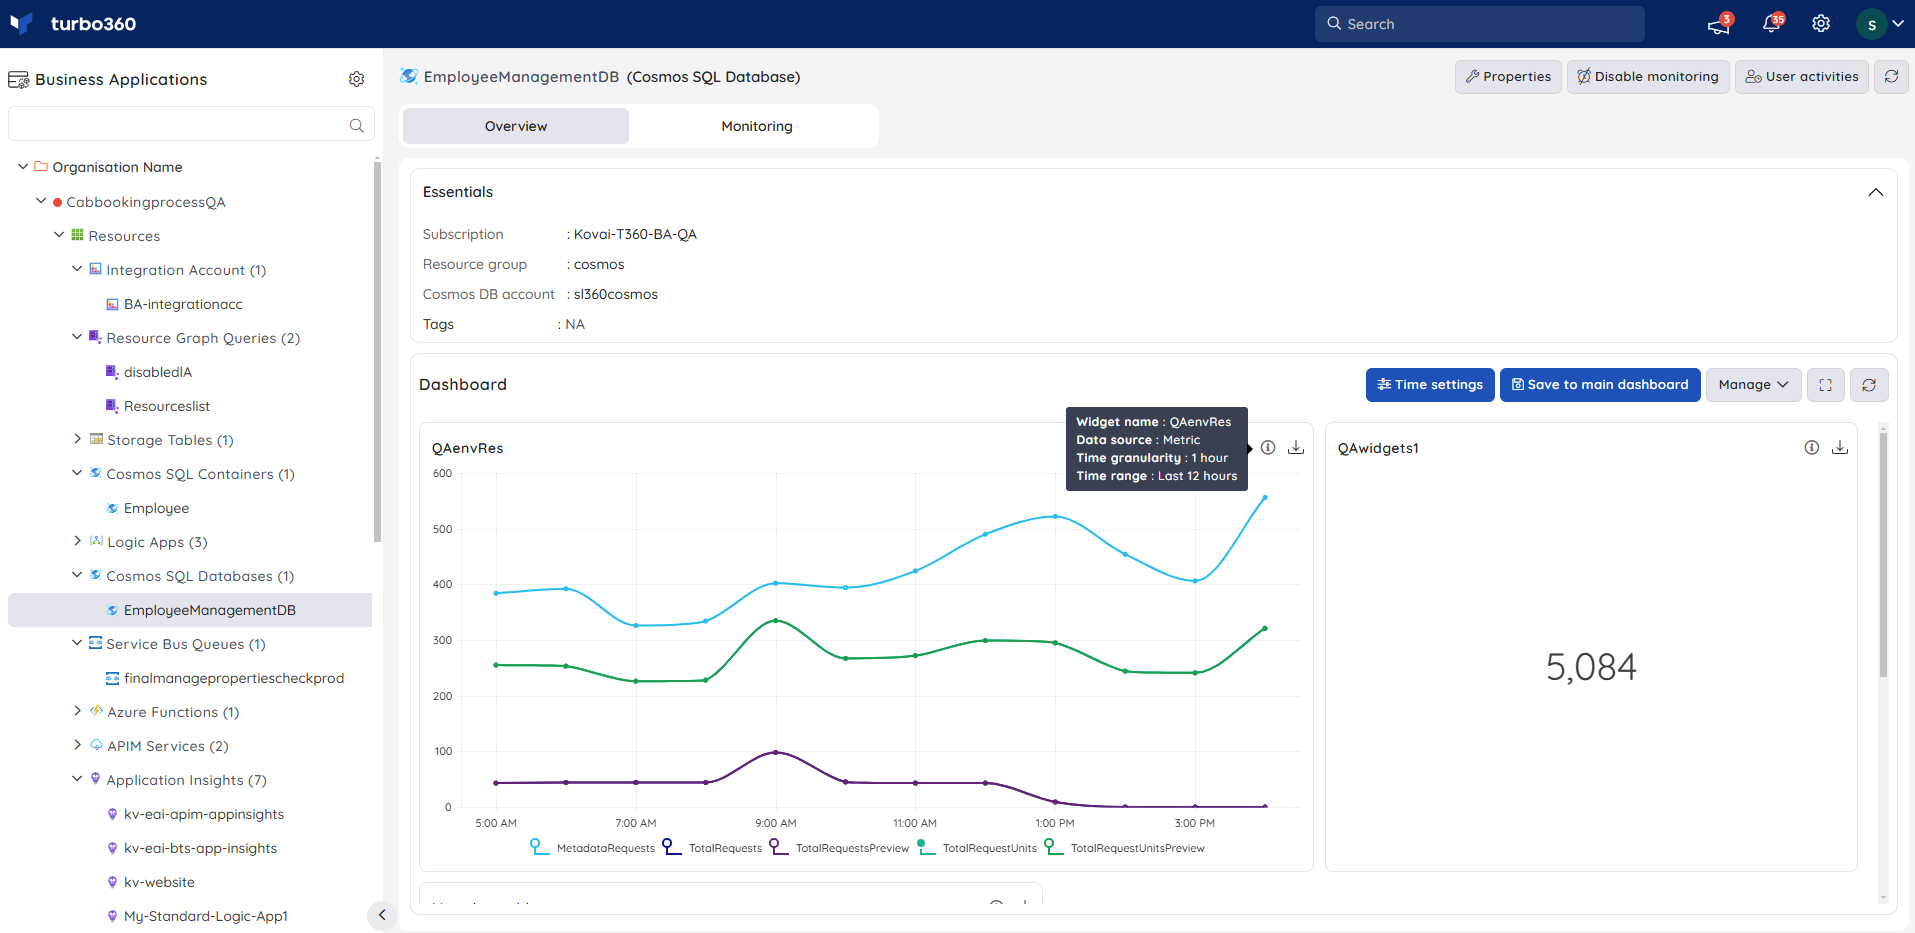
Widget summary
Every resource dashboard widget has an info button that shows an overview of the widget's configuration. Each widget also has a Download option that exports the widget data as an Excel file.
Metrics tab
The Metrics tab is available on every resource dashboard alongside the Dashboard tab. It lets you query any available Azure metric for the resource on demand, without creating a permanent widget. Use it to investigate a specific signal during an incident, spot-check a metric, or validate data before committing to a new widget.
.png)
For the full list of controls and configuration steps, see Managing resource dashboards.
Troubleshooting
Resource dashboard shows no widgets for a resource type
Cause: The resource type is not in the list of pre-configured resource types, or the resource was added as a custom resource type.
Fix: The blank dashboard is still available for this resource. Add widgets manually using the Edit option to build the dashboard you need.Cannot see the resource dashboard — Overview tab is missing
Cause: The resource does not support dashboards, or the user's role does not have resource-level Read permission.
Fix: Confirm the resource type is on the compatible list. Check that the user's role includes resource-level Read access.Widget data is not updating
Cause: The time range may be set outside of a window with active data, or the Azure resource has not emitted metrics recently.
Fix: Adjust the time range. Verify the resource is active in Azure.Save to main dashboard option is not available
Cause: The user has resource-level Manage access but only Dashboard Read permission — Dashboard Manage permission is required to save to the main Business Application dashboard.
Fix: Assign Dashboard Manage permission to the user's role.Download produces an empty Excel file
Cause: There is no data in the current time window for the widget's metric.
Fix: Expand the time range and retry the download.
Related articles
Was this article helpful?