

Resource summary
- 05 Aug 2026
- 5 Minutes to read
- Print
- DarkLight
- Download PDF
Resource summary
- Updated on 05 Aug 2026
- 5 Minutes to read
- Print
- DarkLight
- Download PDF
Article summary
Did you find this summary helpful?
Thank you for your feedback!
Overview
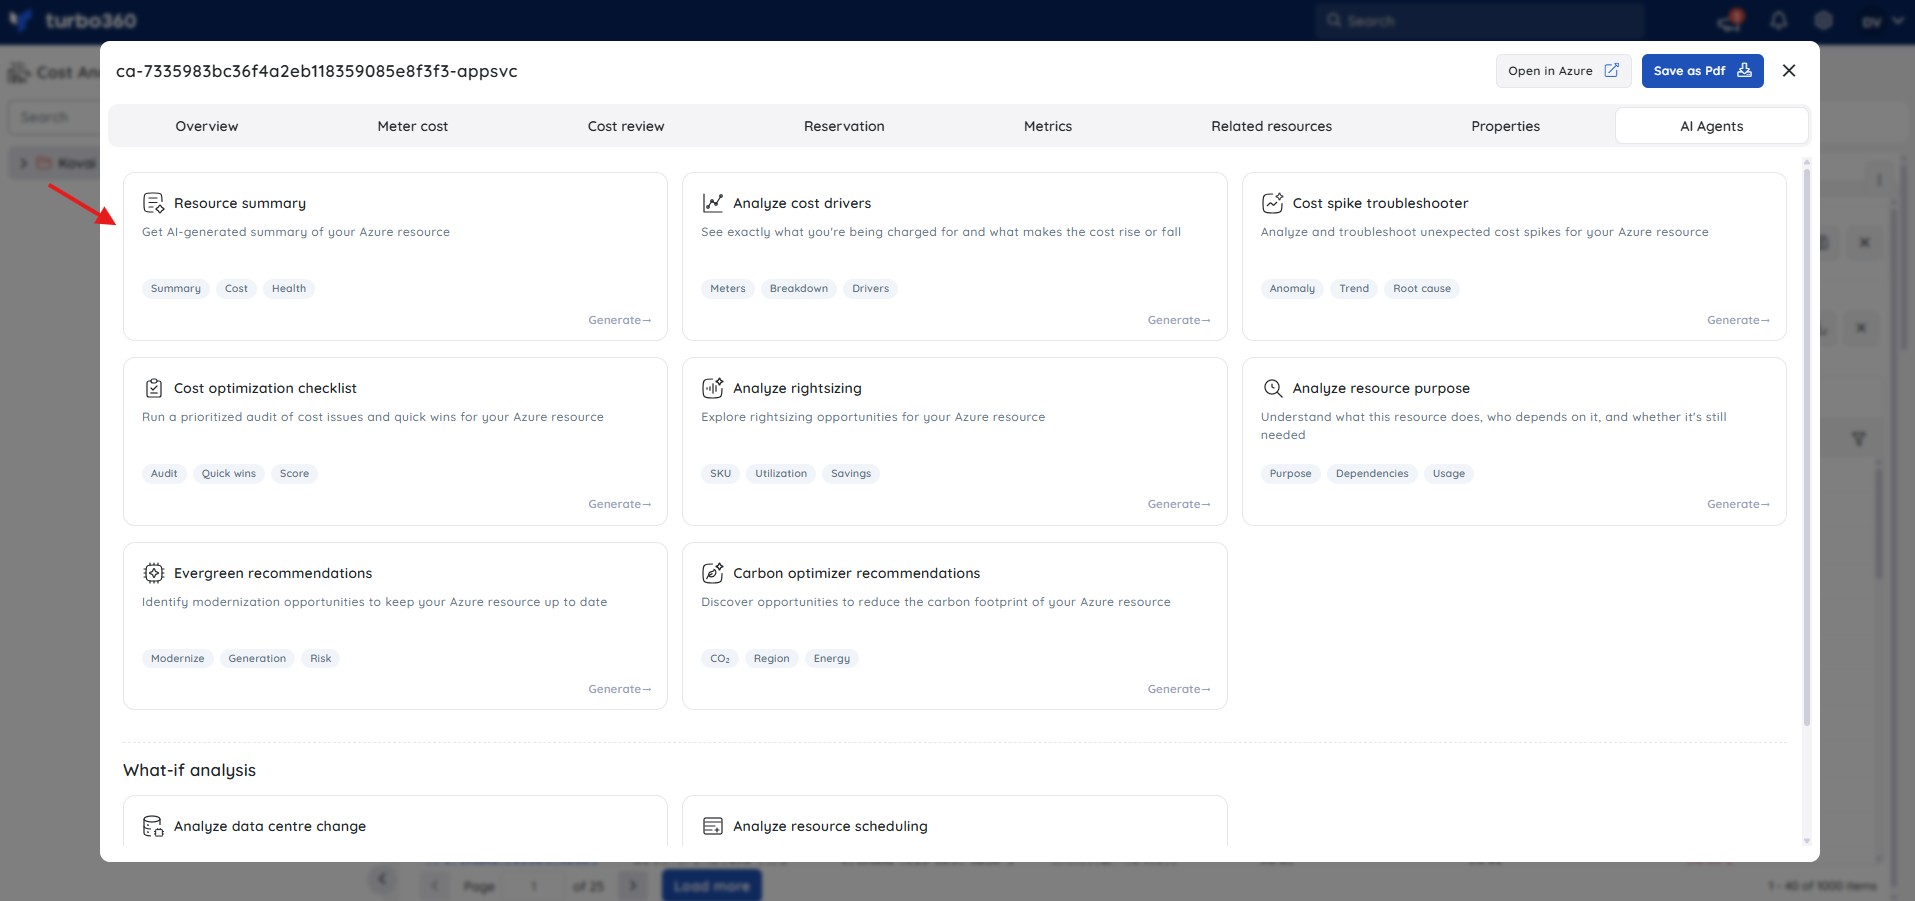
The Cost intelligence view in Cost Analyzer includes a built-in AI agent, Resource summary, available under AI Agents, which provides intelligent, data-driven insights. It automatically analyzes and summarizes the selected resource, highlighting cost trends, utilization efficiency, and actionable optimization recommendations to help you maximize value across your Azure environment.
Business value
Resource summary condenses a resource's cost, usage, and optimization data into a single AI-generated snapshot, reducing the time your team spends manually correlating cost and performance reports before making a decision.
Prerequisites
- On Private Hosting deployments, an Azure OpenAI connection must be configured before this AI Agent can generate insights. See OpenAI setup in Turbo360 for setup instructions. SaaS deployments do not need this step.
Required permissions
Access requires both the AI Agents feature to be enabled for the role and Read access to the Analysis feature, since Resource summary is surfaced from the resource-level Cost intelligence view within Analysis.
| Role | Permission level | Access |
|---|---|---|
| Account Owner / Owner / Contributor | Full access | Can use Analyze cost drivers on any resource |
| Custom role | AI Agents — Enable, Analysis — Read (or Manage) | When AI Agents is set to Enable and Analysis is toggled on with at least Read access, the user can view Resource summary for resources within their assigned scope; if either is missing, the option is not available |
.jpg)
How it works
When you open Resource summary for a resource, the agent generates a structured report organized into the following sections:
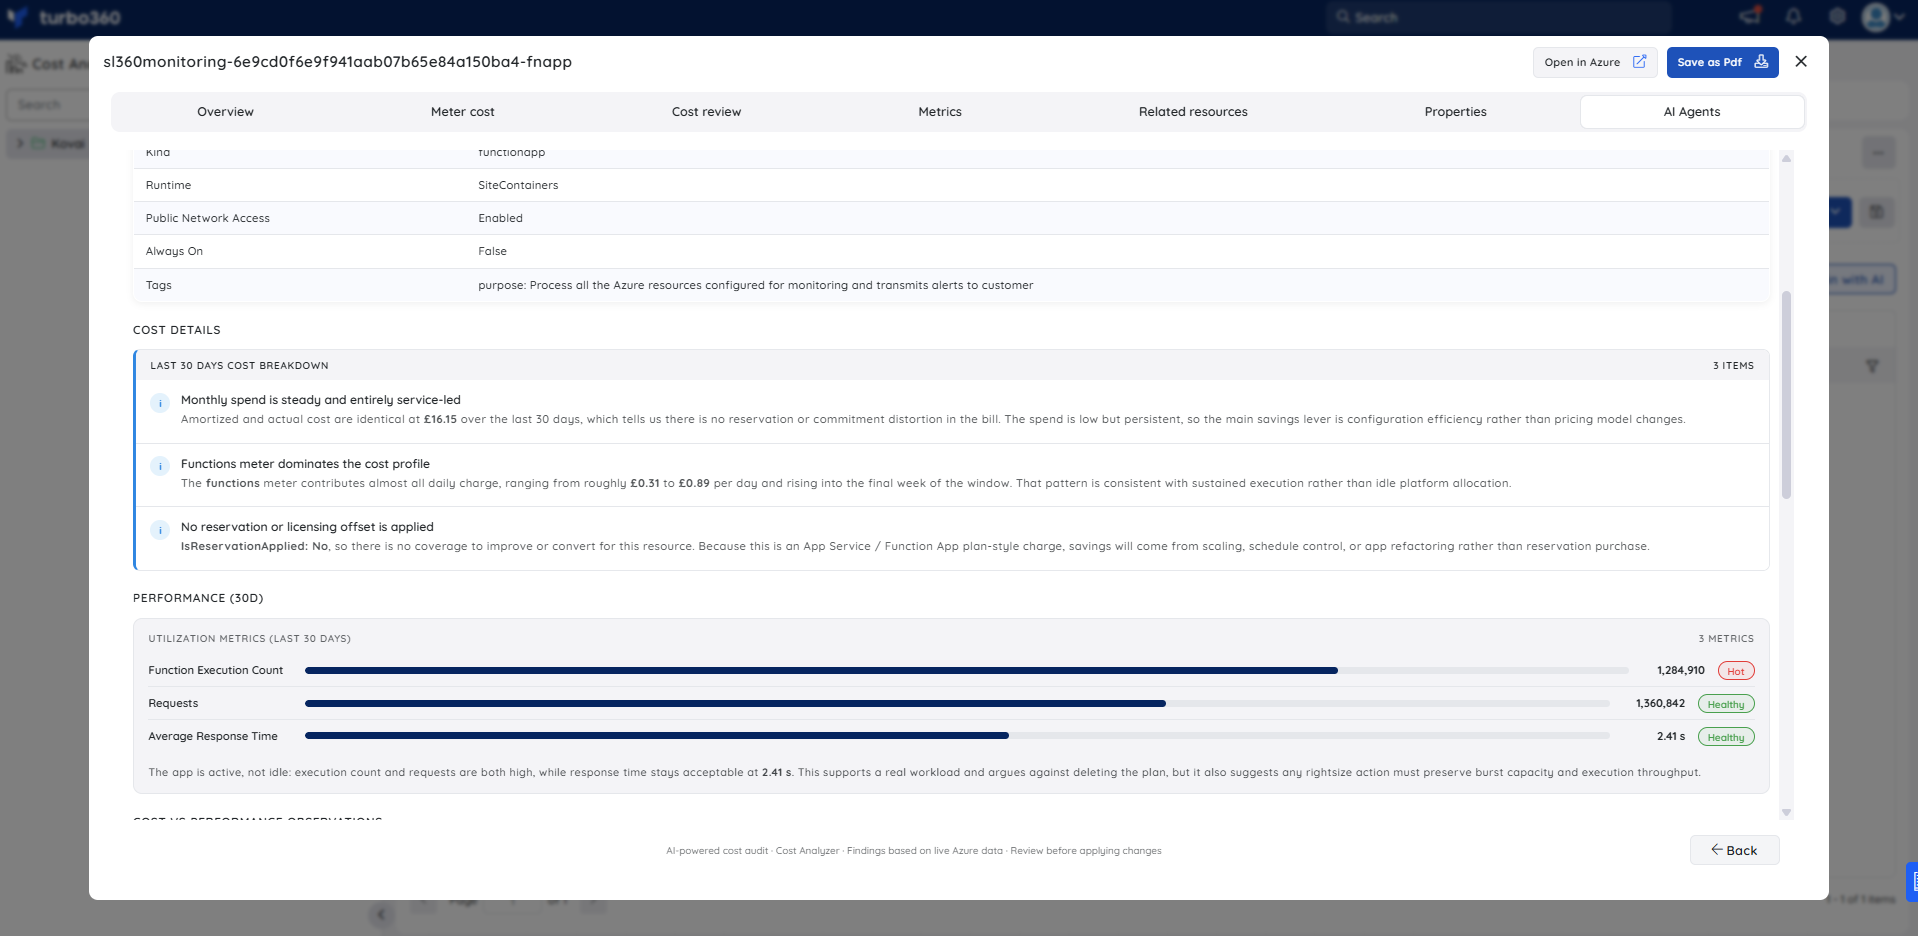
- Resource details — a property table showing the resource's name, type, location, resource group, kind, state, plan mode, network access settings, and any tags applied. This gives you the full resource configuration context alongside the cost data.
- Cost details — AI-written analysis of the resource's cost pattern over the last 30 days, covering monthly cost stability, what is driving spend (for example, which meter family dominates the bill), and whether any commitment coverage such as reservations or savings plans is applied. Each point includes an implication statement.
- Cost review — a side-by-side monthly comparison showing total cost and average cost per day for the two most recent months, with bar charts for visual comparison.
- Meter cost — a daily bar chart broken down by meter family (for example, execution time, total executions, data transfer out), showing which meters are contributing to spend over time.
- Related resources — a table listing resources in the same resource group with their resource type and amortized cost over the last 30 days. This helps identify whether associated resources are contributing to the overall footprint.
- Performance (30D) — utilization metrics for the resource over the last 30 days. If platform metric queries fail or return no usable data, this section notes that and flags rightsizing as blocked until telemetry is restored.
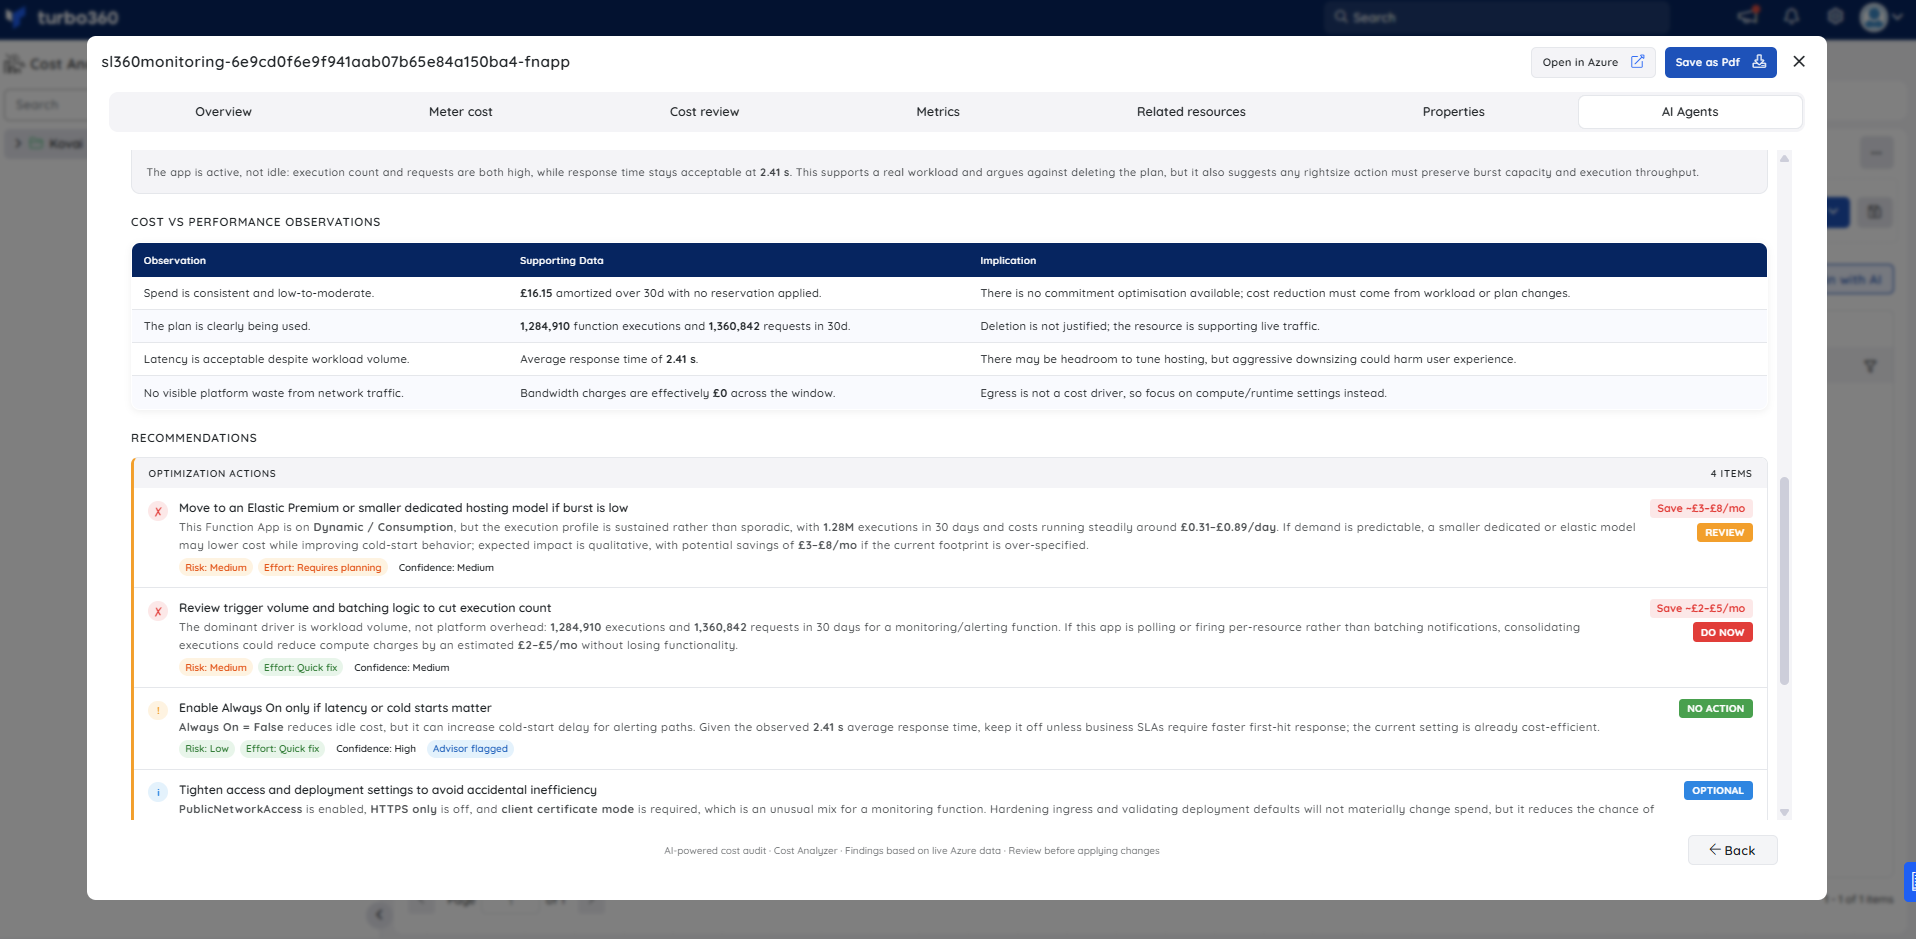
- Cost vs performance observations — a structured table with Observation, Supporting Data, and Implication columns. The agent surfaces the most significant cost-efficiency signals, such as an idle hosting model, missing telemetry, or absence of reservation coverage, and states the operational implication of each.
- Recommendations — a prioritized list of optimization actions with Risk, Effort, and Confidence labels and action buttons (Do Now, Review, Optional). Each recommendation includes a plain-language explanation of the issue and the suggested corrective action.
- Common developer pitfalls — three contextual cards highlighting patterns frequently seen in workloads of this type that lead to cost waste (for example, misaligned hosting model, monitoring code that polls too often, skipping observability for small workloads).
- Quick summary — a single callout that states the single best action to take given the full analysis. This is the agent's top-level recommendation in plain language.
Example scenario
An engineer reviewing a Function App resource in Cost Analyzer opens Resource summary under AI Agents to investigate whether the resource's hosting model and spend pattern are well-matched.
The agent generates a full report for the resource. The Resource details section confirms the resource is a functionapp of type Microsoft.Web/sites, running on a Dynamic plan with Public Network Access enabled. The Cost details section identifies that spend is stable at around $16/month, almost entirely runtime-driven by the functions execution meter, with no commitment coverage applied. The Performance (30D) section reports that platform metric queries failed, returning no usable CPU, memory, or queue signal — flagging rightsizing as blocked until telemetry is restored.
The Cost vs performance observations table surfaces four findings: spend is low but non-negligible for an always-on host, no reservation benefit is being used, performance telemetry is effectively missing, and networking cost is not the issue. The Recommendations section returns four prioritized actions — fix telemetry first as a Do Now, then review whether the app needs dedicated hosting at all, audit always-on cost drivers, and verify environment naming for hidden duplication. The Quick summary states that the function app should not be rightsized until telemetry is fixed.
Limitations
Resource summary is an AI-generated analysis. Always review the output before using it as the basis for infrastructure or cost decisions.
Troubleshooting
- Resource summary tab is not visible for a resource
Cause: The user's Custom role does not have the AI Agents feature permission enabled.
Fix: Go to User management > Roles, edit the relevant Custom role, and enable the AI Agents toggle under Specify feature permissions. - No summary is generated for a resource
Cause: The OpenAI connection is not configured or has failed validation (Private Hosting only).
Fix: See OpenAI setup in Turbo360 to verify or reconfigure the connection. - Summary output appears incomplete or missing sections
Cause: The resource may have insufficient cost or usage history for the agent to analyze (for example, a newly provisioned resource with less than a few days of data).
Fix: Wait until the resource has accumulated at least several days of cost and usage data, then run Resource summary again. - Performance (30D) section shows no usable metrics
Cause: Platform metric queries for the resource type failed or returned no data, typically because App Service Plan metrics are not enabled or the resource lacks the correct diagnostic settings.
Fix: Re-enable the correct App Service Plan metrics in the Azure portal and verify that diagnostic settings are configured to export CPU, memory, and queue metrics. Re-run Resource summary after metrics have been collecting for at least one monitoring cycle.
FAQs
- Does Resource summary work the same way on SaaS and Private Hosting?
Yes. The insights generated are the same; only the underlying OpenAI connection setup differs between SaaS and Private Hosting. - How much historical data does Resource summary use?
It analyzes 30-day cost and usage analytics for the resource, along with its current configuration and performance metrics.
Related articles
Was this article helpful?