

Run your first Cost Analysis
- 05 Aug 2026
- 5 Minutes to read
- Print
- DarkLight
- Download PDF
Run your first Cost Analysis
- Updated on 05 Aug 2026
- 5 Minutes to read
- Print
- DarkLight
- Download PDF
Article summary
Did you find this summary helpful?
Thank you for your feedback!
Overview
With your Azure subscriptions connected and billing data importing, you're ready to run your first cost analysis. This article walks you through configuring your first view and saving it for ongoing monitoring.
Business value
- Understand your Azure spending within minutes of completing setup
- Learn the key filters and groupings that shape every analysis view
- Save your first cost view for ongoing monitoring
Prerequisites
- Cost Analyzer setup completed via the onboarding wizard
- At least one subscription with Healthy status in Cost imports
Required permissions
| Permission | Scope | Purpose |
|---|---|---|
| Reader | Turbo360 cost management group | Required to view cost data in Analysis |
How it works
The Analysis section displays Azure subscription costs as interactive charts and tables. Every view is shaped by a set of filters — subscription, time interval, granularity, group by, and metric — applied together to produce a focused cost picture.
Cost data is organized within cost management groups, which define the scope of your analysis. When you open Cost Analyzer after setup, you'll see the cost management groups created during the onboarding wizard.
Steps
Follow these steps to configure and save your first cost analysis view in Cost Analyzer > Analysis.
Open the Analysis section
Navigate to the Analysis section within your cost management group to begin building a view.
- In Turbo360, navigate to Cost Analyzer.
- Select a cost management group from the left panel.
- Click Analysis in the top navigation.
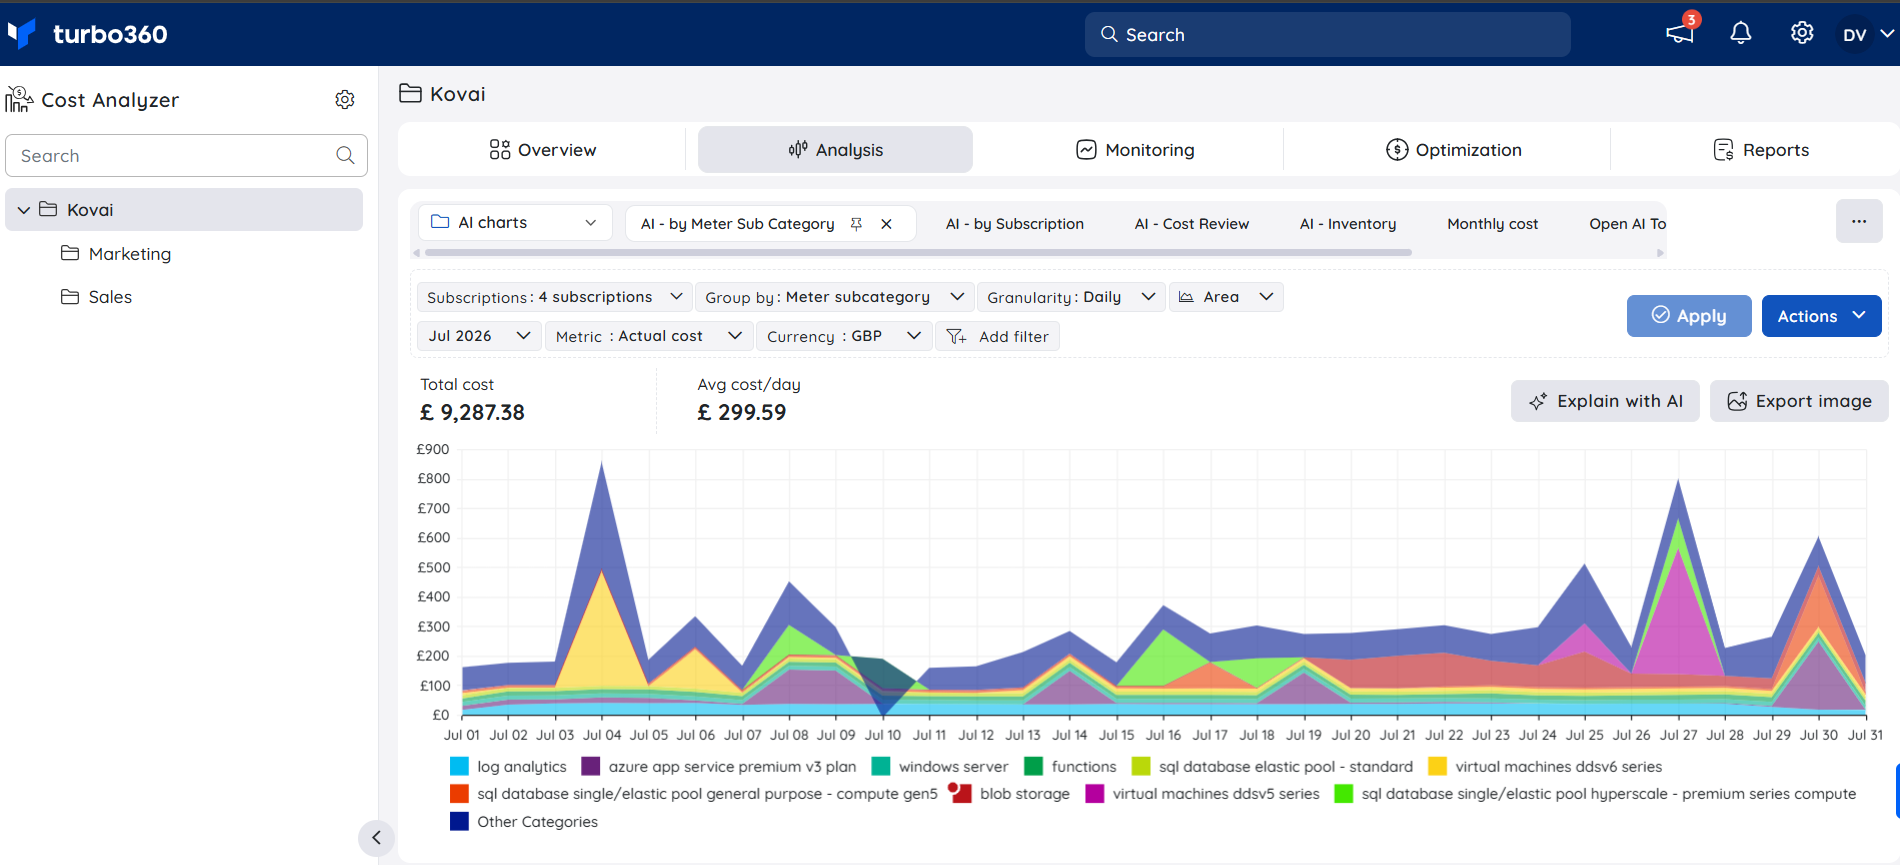
Select subscriptions
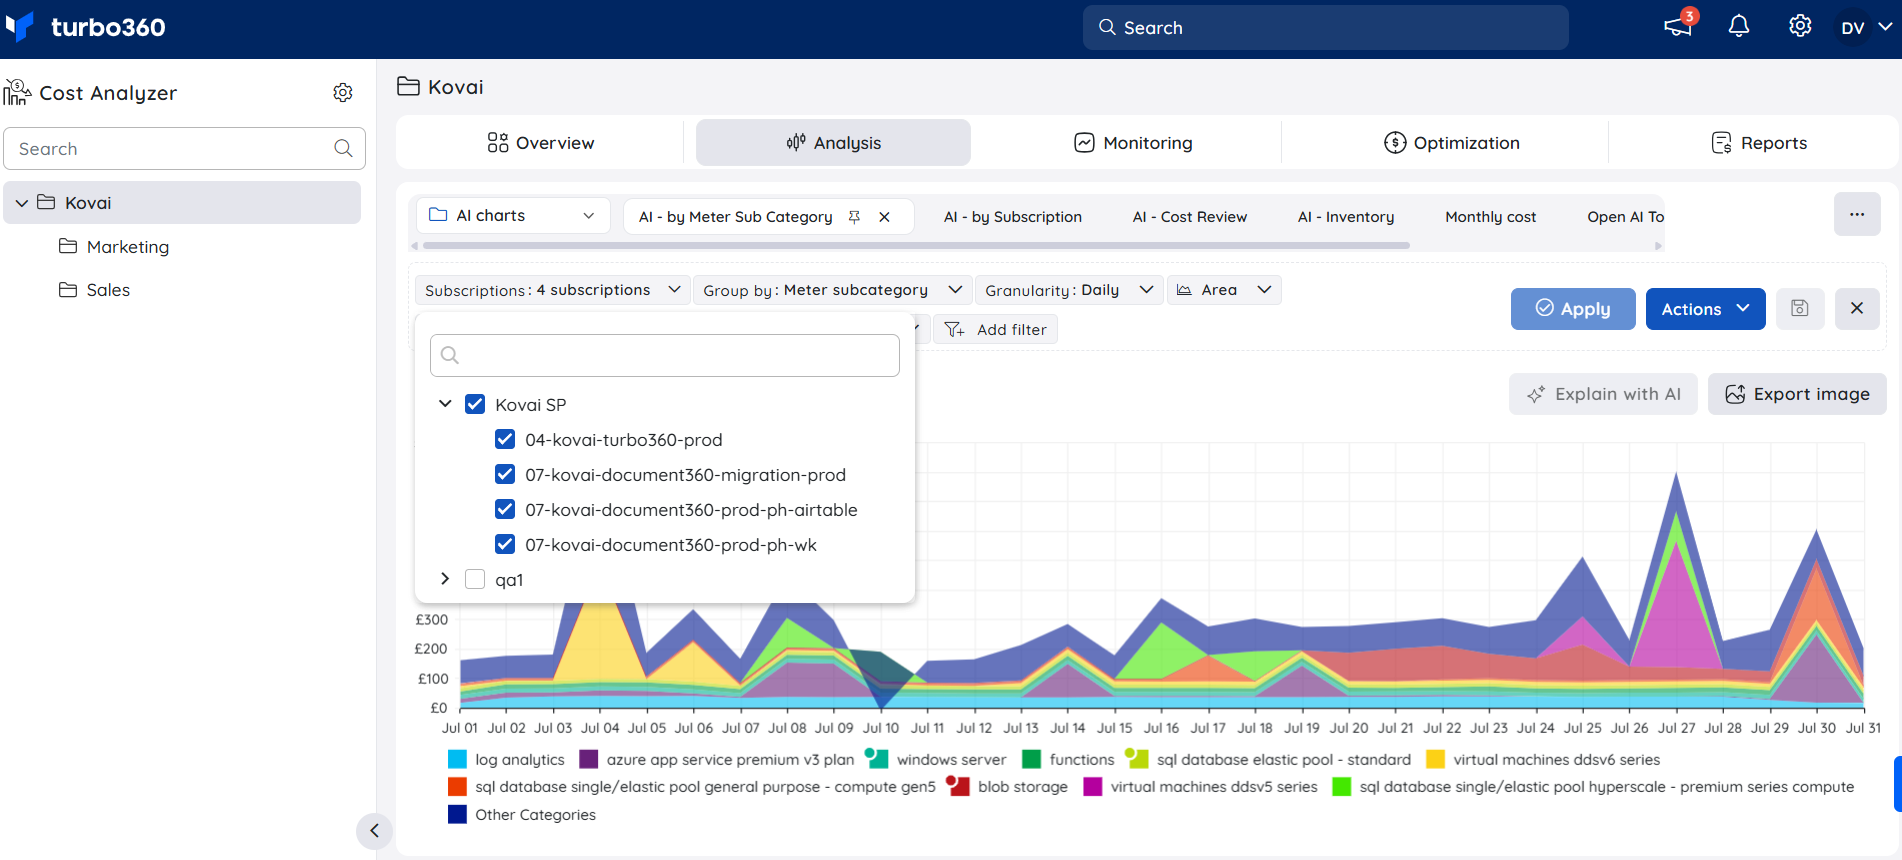
Choose the Azure subscriptions whose cost data you want to include in the analysis.
In the Subscriptions filter, select the Azure subscription(s) to analyze. The view shows the total cost and daily average cost for the selection.
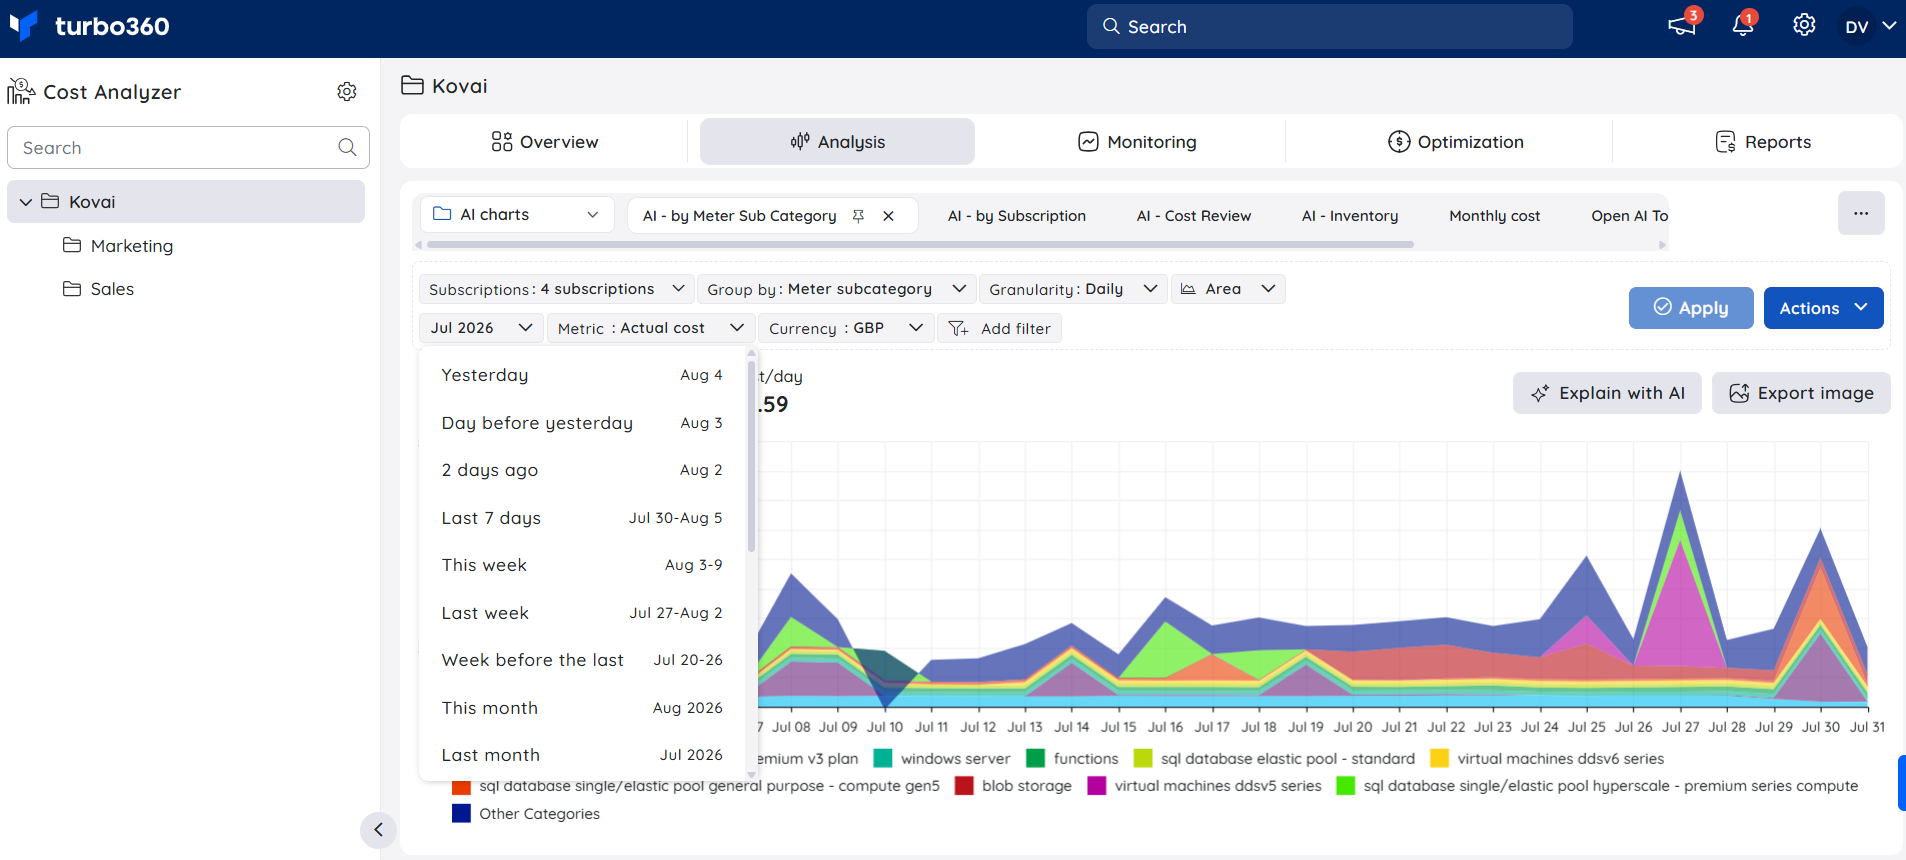
Set the time interval
Define the date range for the cost data you want to analyze.
Select a preset interval (Last Month, This Month, etc.) or choose Custom to enter a date range. Custom ranges are limited to 1 year from today.
Choose granularity
Select how cost data is aggregated in the chart:
- Accumulated — cumulative cost across the period
- Daily — cost per day (recommended for first analysis)
- Monthly — cost per month
- None — total cost without time breakdown
Group the data
Apply a Group by dimension to break down costs and identify where spend is concentrated.
| Option | Use when you want to… |
|---|---|
| Resource | See which resources are the biggest cost drivers |
| Resource Group | Compare costs across resource groups |
| Resource Type | Identify which Azure service types cost the most |
| Subscription | Compare spend across subscriptions |
| Tag | Allocate costs to teams or projects |
| Location | See costs by Azure region |
| Service Name | Analyze costs by Azure service |
| Meter | Break down costs by Azure billing meter |
| Meter subcategory | Drill into meter-level subcategories |
| Service Family | Group costs by Azure service family (e.g. Compute, Storage) |
| Product Name | View costs by specific Azure product |
| Pricing Model | Compare costs across pricing models (e.g. On-Demand, Reservation) |
| Charge Type | Distinguish between usage charges, purchases, and adjustments |
| Reservation | Analyze costs associated with Azure Reservations |
| Benefit | View costs related to applied Azure benefits |
| Publisher Name | See costs by publisher (Microsoft or third-party Marketplace) |
| Publisher Type | Distinguish between Microsoft and Marketplace publisher types |
Resource Type or Resource Group gives the clearest initial picture.
Select a chart type
Choose how the cost data is rendered to best suit your analysis goal.
- Area — cost trends over time
- Column (stacked) — category contributions per period (recommended)
- Column (grouped) — categories side by side
- Line — trends across multiple categories
- Table — exact cost figures per category
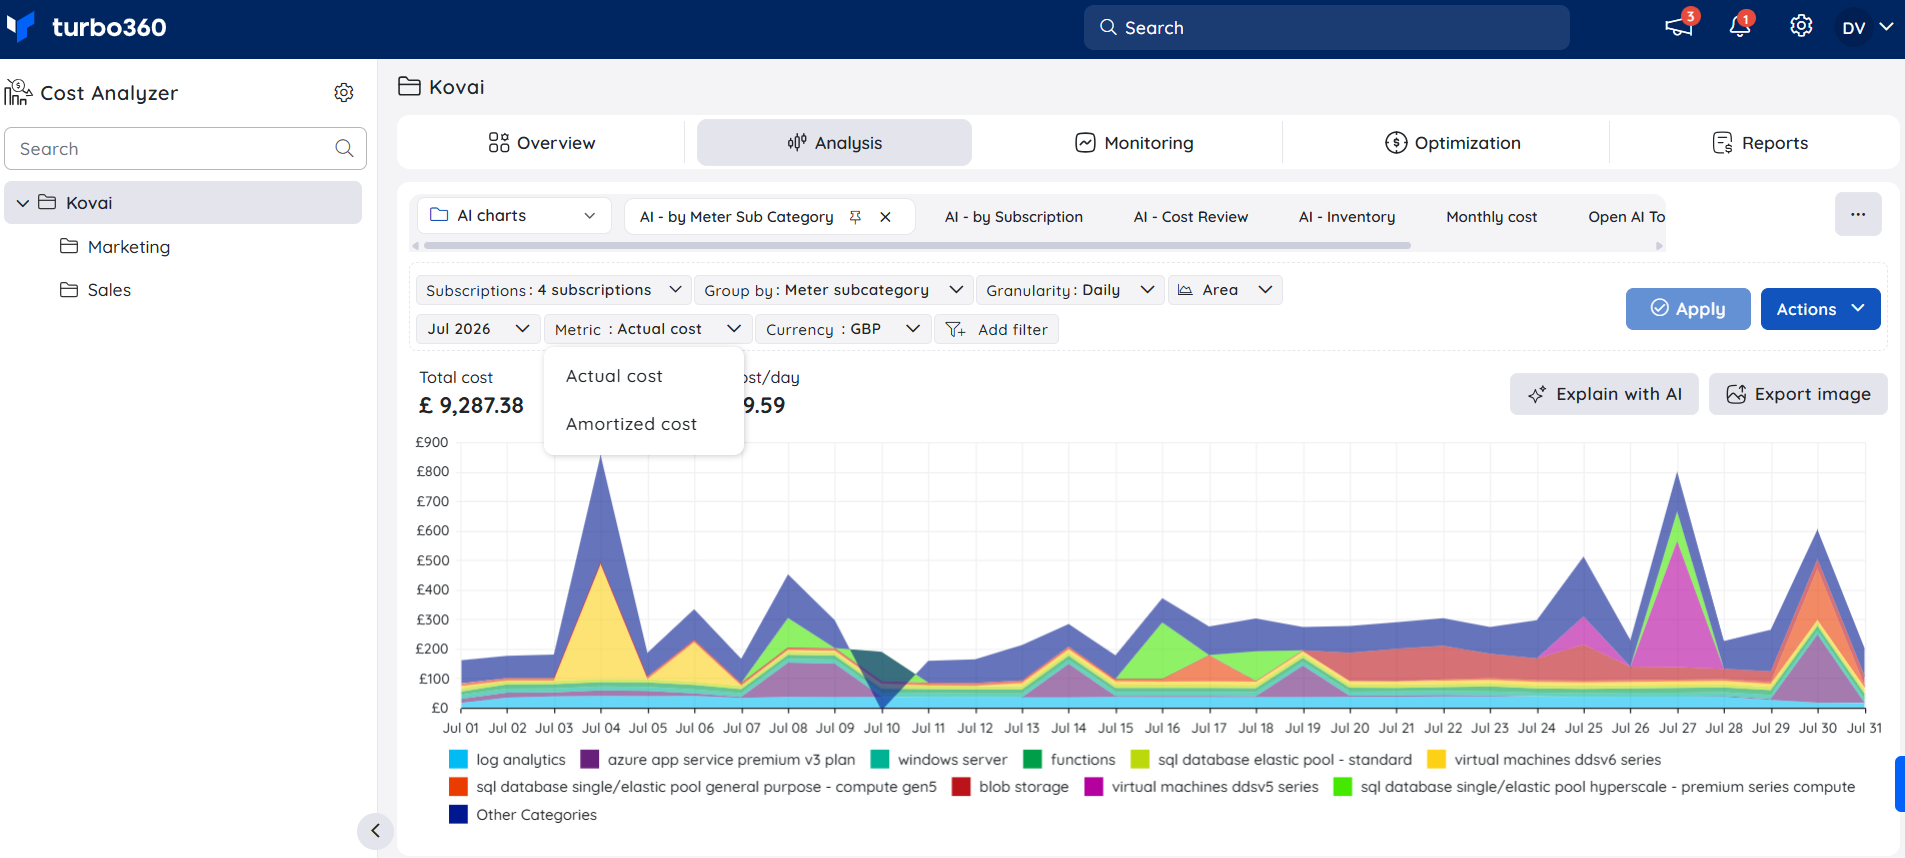
Choose a cost metric
Select whether to view costs as billed or spread evenly across the period.
- Actual cost — raw usage and purchases as they appear on the invoice
- Amortized cost — reservation charges spread evenly over the reservation term
Start with Actual cost for your first analysis.
Apply and review
Render the view with your selected filters and explore the cost breakdown.
- Click Apply.
- Hover over data points to see cost breakdowns per category.
- Click a data point to drill into a specific category.
Save the view
Save the configured view so it can be accessed again from the left panel without reconfiguring filters.
- Click Save view (or Save as).
- Name the view — for example, "Last month — Production by resource type".
Saved views appear in the left panel under your cost management group.
Example scenario
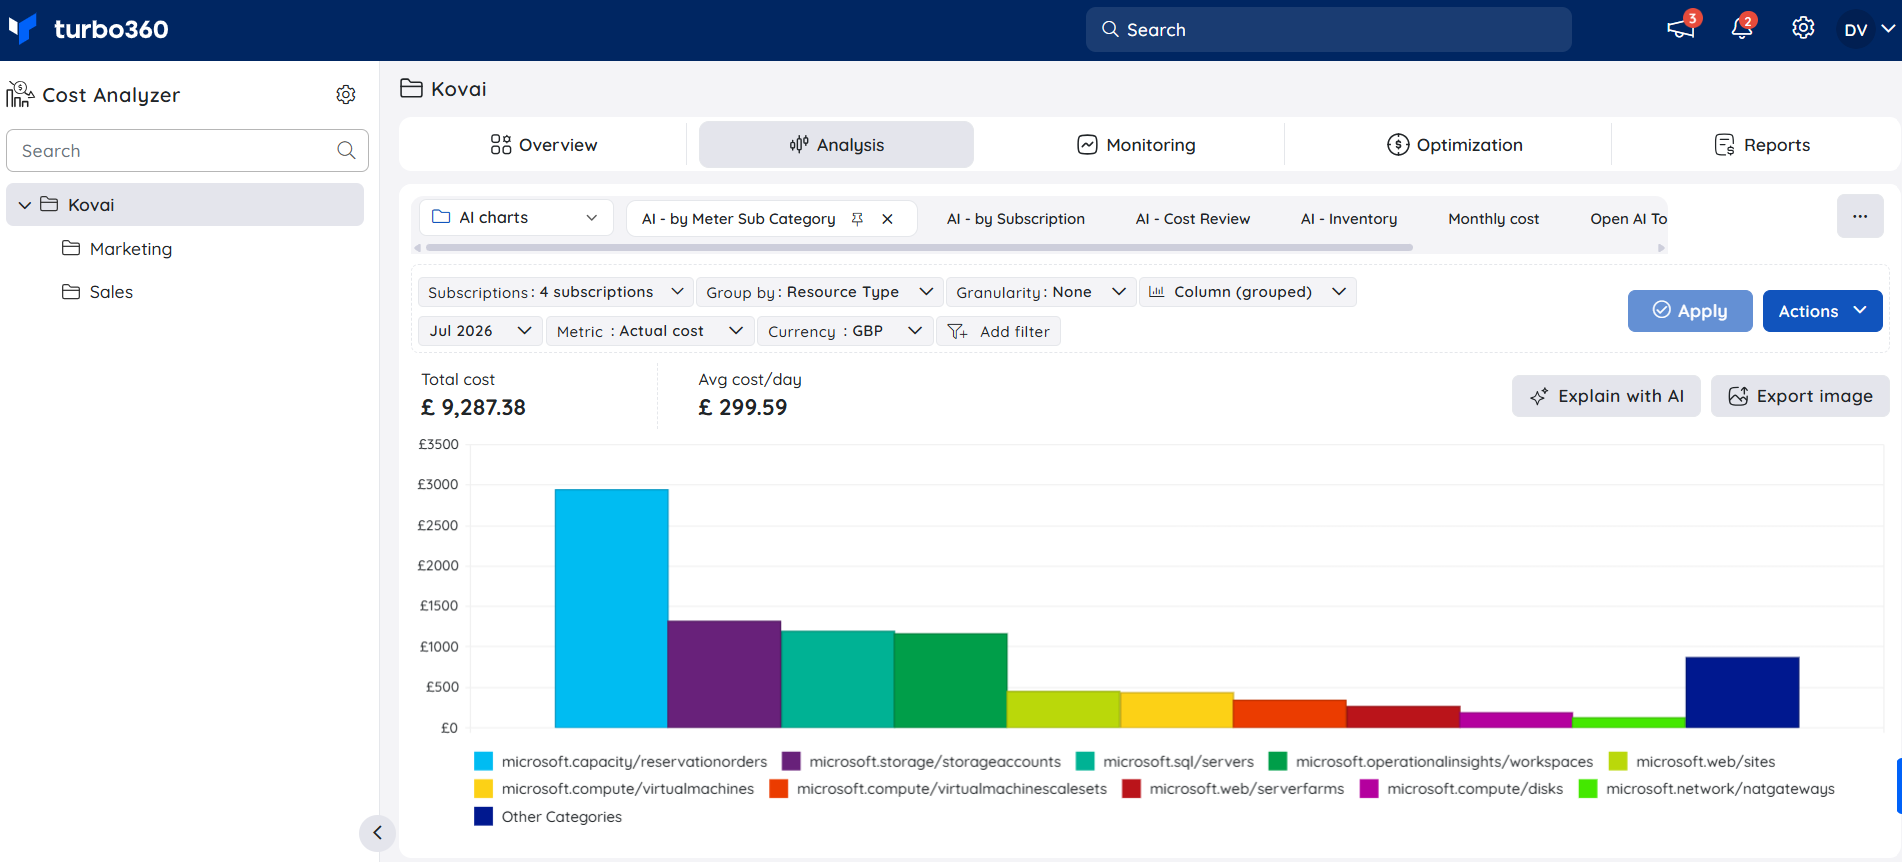
A cloud administrator selects the Production subscription, sets Last Month, None granularity, Resource Type group by, and Column (grouped) chart, then clicks Apply. The chart shows Virtual Machines and Storage as the top cost categories. They save the view for future reference.
Limitations
- Custom date ranges are limited to 1 year from the current date.
- Forecasting is only available for time intervals that include today or future dates.
- The Area chart is unavailable when Granularity is set to None.
Troubleshooting
No cost data is appearing
Cause: No subscription is selected, or the subscription does not yet show Healthy in Cost imports.
Fix: Confirm a subscription is selected with Healthy status. If recently imported, allow a few minutes for data to propagate.Chart is empty after clicking Apply
Cause: The selected time interval may predate the imported data range.
Fix: Try Last Month or This Month.Forecasting is not appearing
Cause: The time interval does not include today or a future date, or Granularity is set to None.
Fix: Select a time interval that includes today and choose any granularity other than None.Cost data appears outdated
Cause: The view may be using cached data.
Fix: Go to Actions > Reset cached data within the saved view to force a refresh.Amortized cost differs from expected
Cause: Amortized cost spreads reservation charges over the term, which differs from invoice cost when active reservations exist.
Fix: Switch to Actual cost to see invoice-aligned figures.
FAQs
Can I create multiple saved views?
Yes. Save as many views as needed within a cost management group. Each retains its own filter configuration.What is the difference between Actual and Amortized cost?
Actual cost reflects the invoice. Amortized cost spreads reservation purchases evenly over the term for a more consistent ongoing view.
Related articles
Was this article helpful?