

Savings tracker
- 05 Aug 2026
- 5 Minutes to read
- Print
- DarkLight
- Download PDF
Savings tracker
- Updated on 05 Aug 2026
- 5 Minutes to read
- Print
- DarkLight
- Download PDF
Article summary
Did you find this summary helpful?
Thank you for your feedback!
Overview
Savings tracker lets you compare the cloud costs of a cost management group across two time periods and identify unrealized savings opportunities. It shows total spend for each period, an Opportunity Profile radar chart across optimization categories, and a detailed category-level breakdown of period-over-period changes.
Business value
Savings tracker turns optimization recommendations into a measurable before-and-after comparison. Instead of manually cross-referencing billing data across months, teams can see at a glance how much unrealized savings potential shifted between two periods, and which optimization category — Rightsizing, Reservations, or Other Recommendations — is driving that change.
Prerequisites
A cost management group with cost data for at least the two calendar months you want to compare.
Required permissions
Savings tracker is visible in the Cost management group's Context menu ( ⋮ ) only for users with sufficient permissions.
| Role | Access |
|---|---|
| Account owner | Full access to Savings tracker |
| Contributor | Full access to Savings tracker |
| Reader | Full access to Savings tracker |
| Custom role | Requires at least Read access on Analysis, Rightsizing, Reservations, and Other Recommendations |
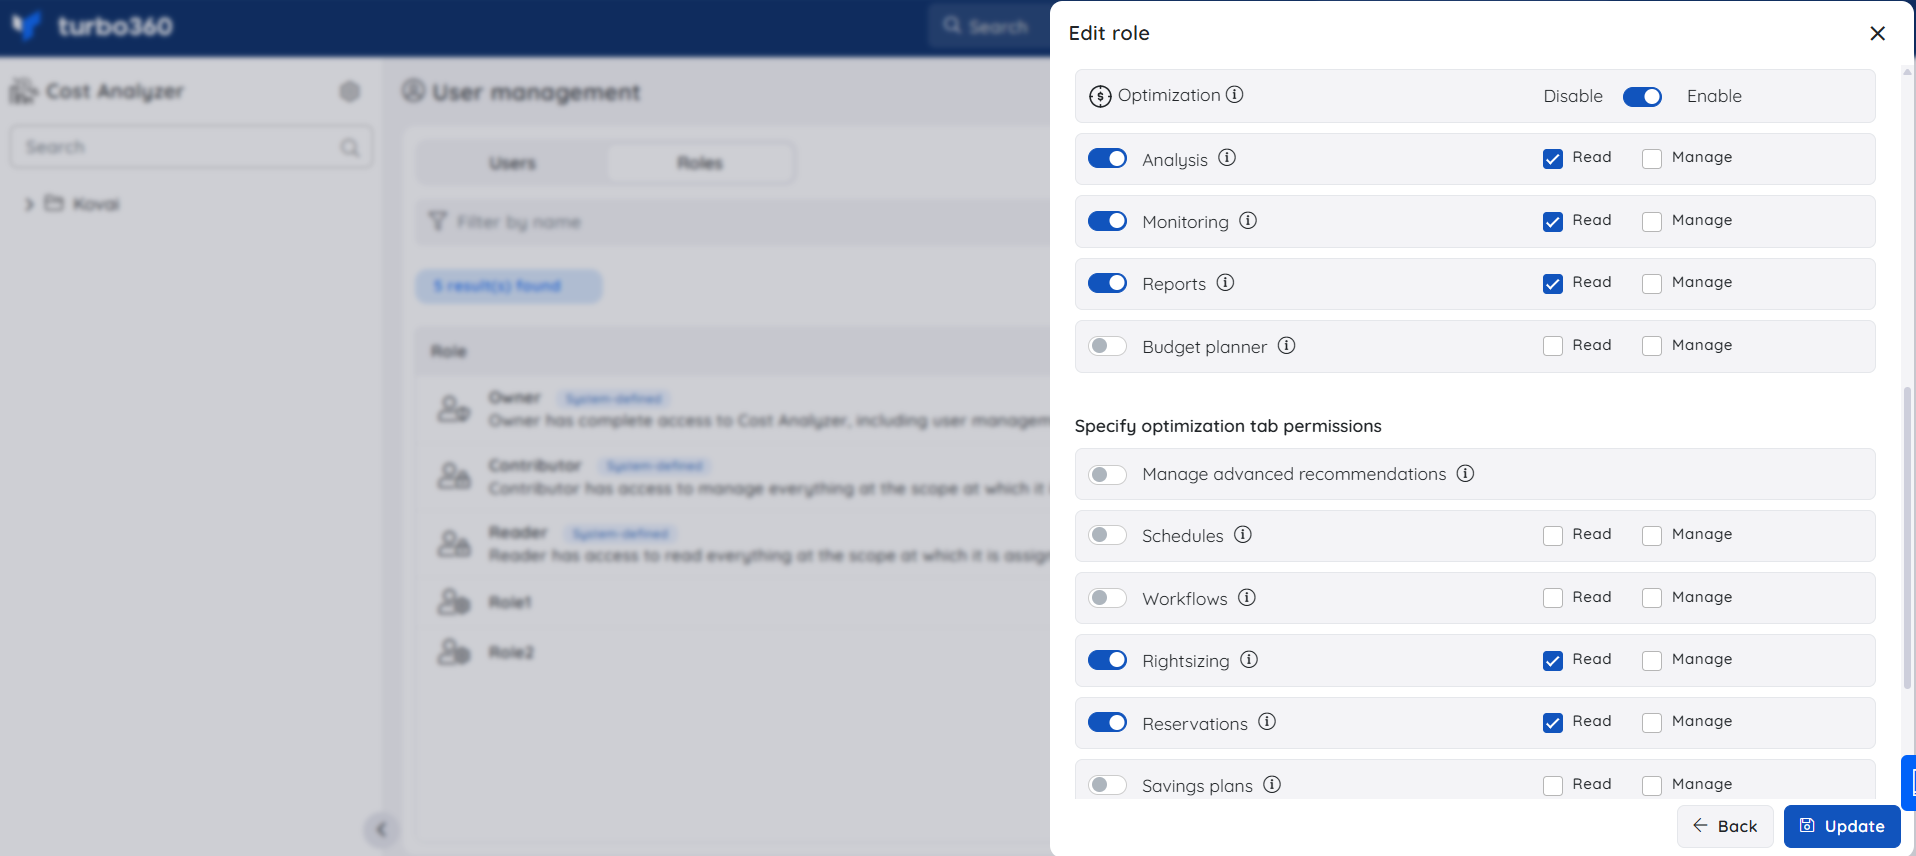
All other users will not see the Savings tracker option in the Context menu ( ⋮ ) of a cost management group.
How it works
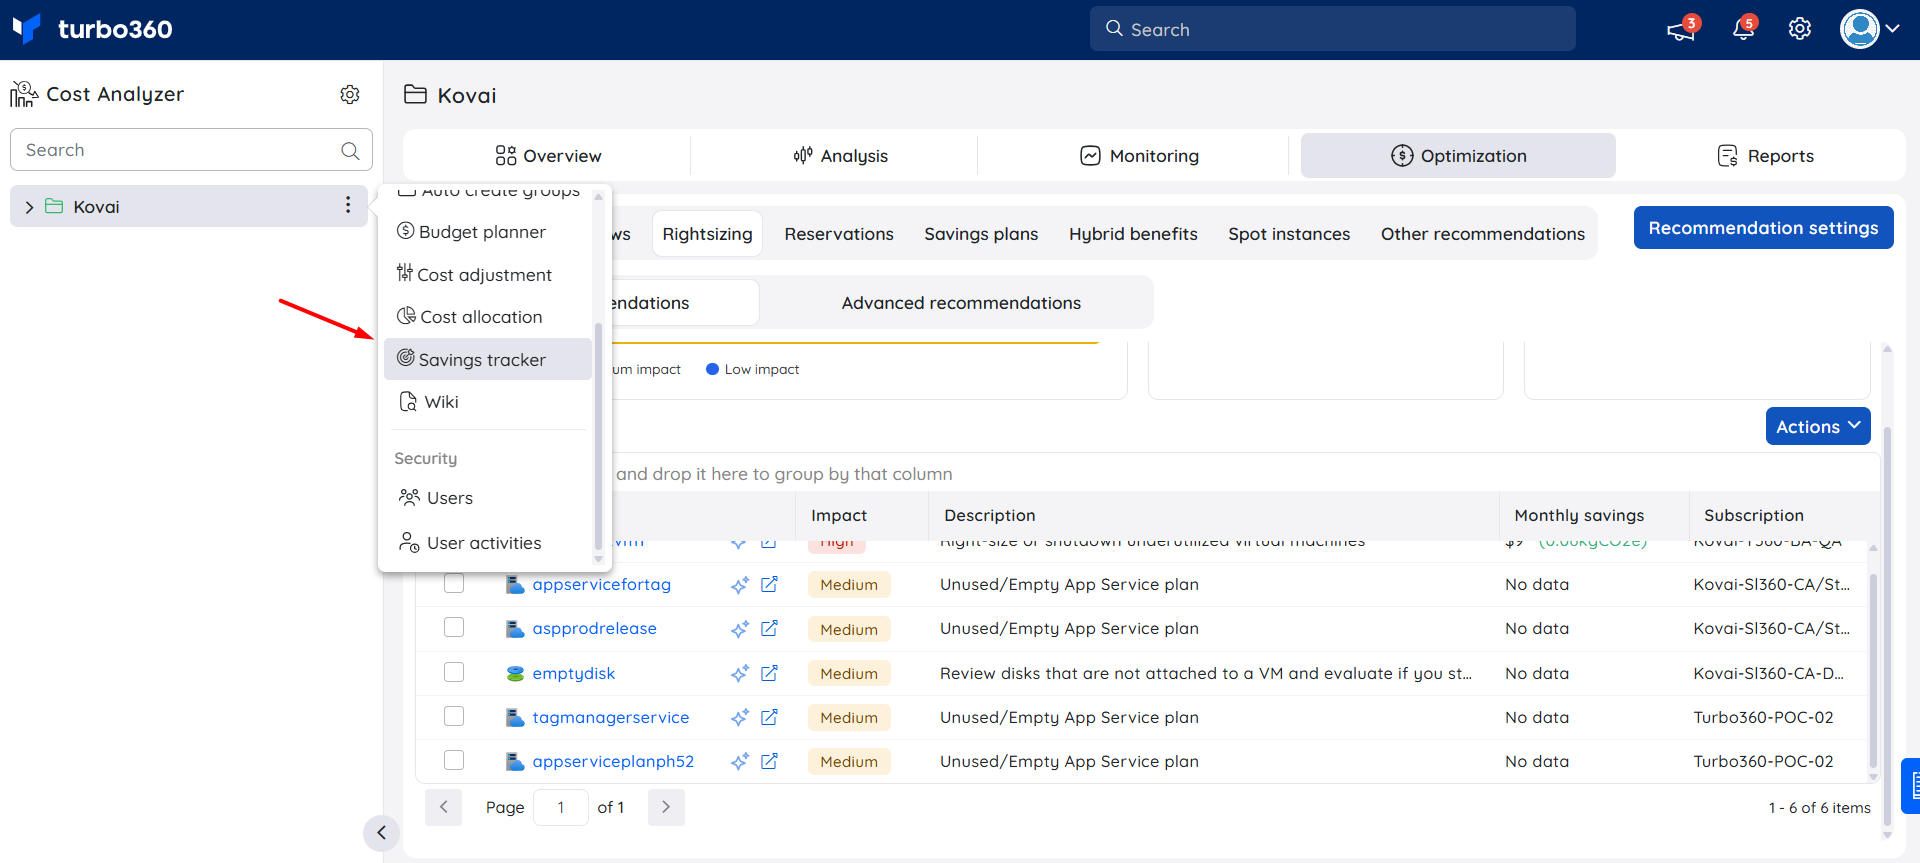
Savings tracker is opened from a cost management group in the tree view.
- Go to Cost Analyzer and locate the cost management group you want to analyze.
- Click the Context menu ( ⋮ ) next to the group in the tree view.
- Select Savings tracker.
Configuration
Use the controls at the top of the panel to set up your comparison before viewing results.
Period A and Period B
Select any two calendar months to compare. Period A serves as the baseline and Period B as the comparison period. The two months do not need to be consecutive.
Cost type
Choose how costs are measured across both periods:
- Amortized cost — spreads one-time upfront reservation fees evenly across the usage period.
- Actual cost — reflects charges exactly as billed, including any upfront payments in the month they occurred.
Currency mismatch
If Period A and Period B are billed in different currencies, Savings tracker automatically converts one period's values to the other period's currency so all figures are directly comparable.
Reading the results
Total cost cards
Two summary cards at the top of the panel show the total spend for each period across the entire cost management group — for example, £632 for Period A and £364 for Period B.
.png)
Opportunity Profile
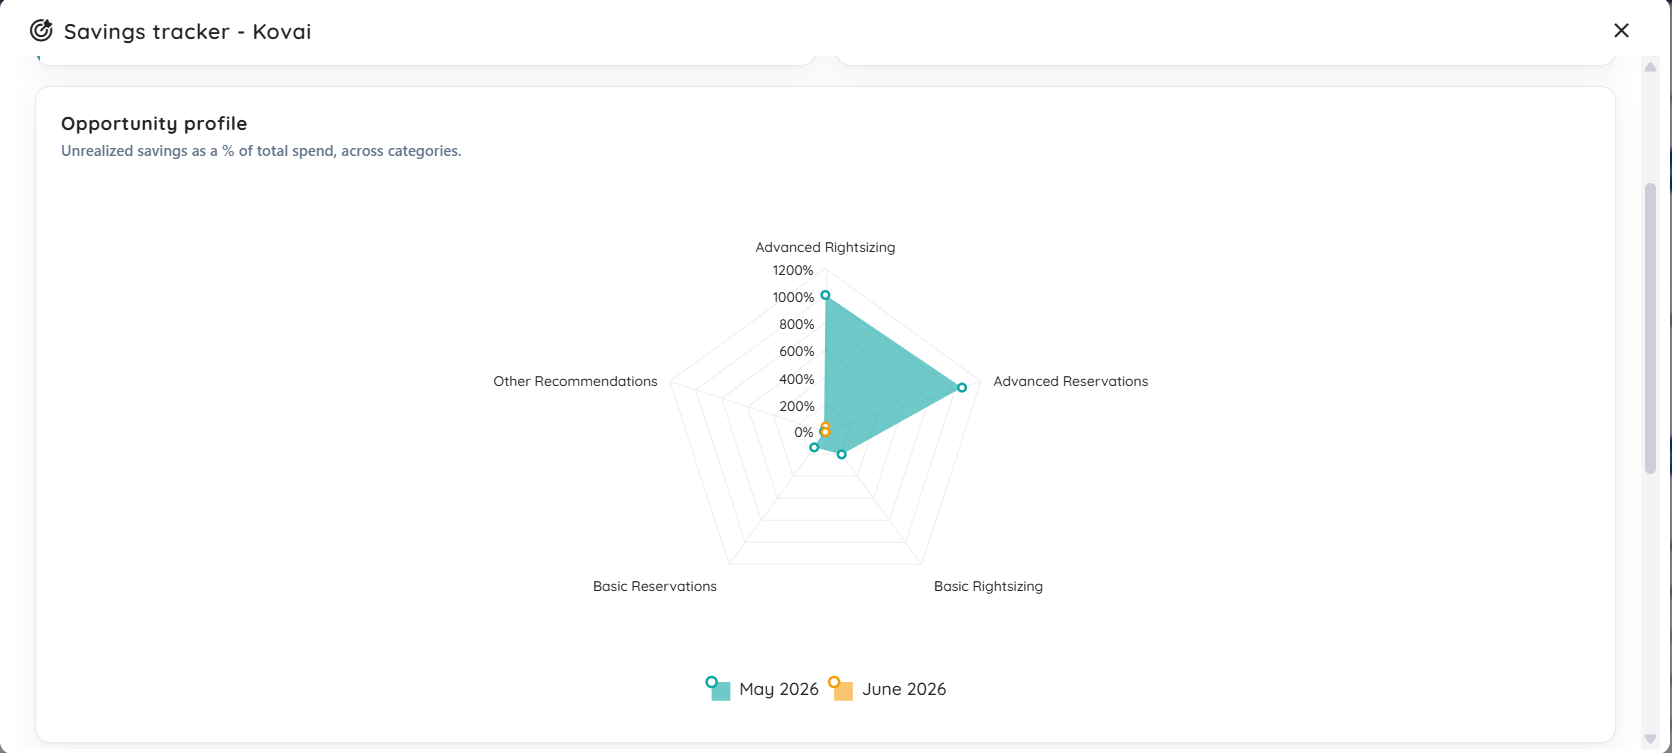
The radar chart plots unrealized savings as a percentage of total spend across five optimization categories. Two overlapping polygons — one per period — make it easy to see which categories have gained or lost savings potential between periods. A larger area means more unrealized savings opportunity.
Detailed breakdown
The table beneath the chart provides exact values for each optimization category in both periods, plus the change in percentage points (pp). A positive change (▲) means more unrealized savings in that category. A neutral change (—) means no movement between periods. The percentage for each category is calculated by comparing its estimated savings against the total cost for the selected period. These figures represent unrealized savings — opportunities detected by Turbo360 that have not yet been applied.
.png)
Exporting the report
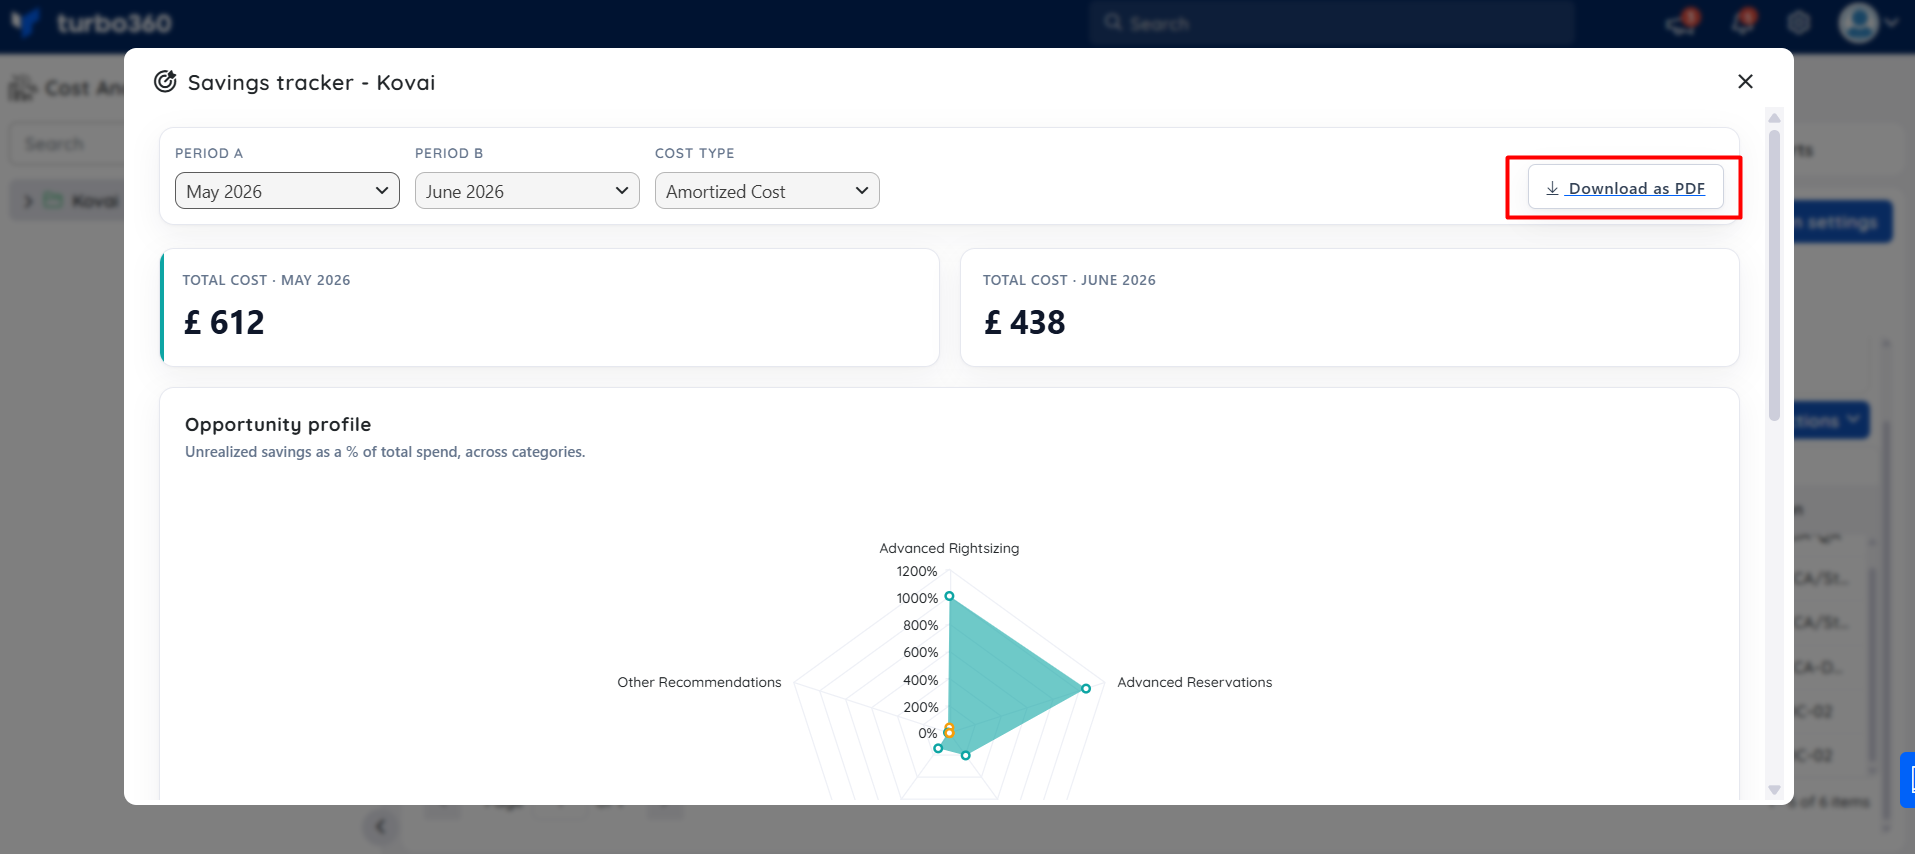
The full Savings tracker view can be downloaded as a PDF. Click Download as PDF in the top-right corner of the panel to generate and download it immediately.
Example scenario
Comparing May 2026 against June 2026 using Amortized Cost:
| Category | May 2026 | June 2026 | Change |
|---|---|---|---|
| Advanced Rightsizing | 1004.87% (£6,155) | 40.09% (£175) | ▼ 964.78pp |
| Advanced Reservations | 1053.81% (£6,454) | 0.00% (£0) | ▼ 1053.81pp |
| Basic Rightsizing | 203.43% (£1,246) | 1.54% (£7) | ▼ 201.89pp |
| Basic Reservations | 139.19% (£853) | 0.00% (£0) | ▼ 139.19pp |
| Other Recommendations | 10.49% (£64) | 0.00% (£0) | ▼ 10.49pp |
Every category shows a decline in unrealized savings from May to June, indicating that the recommendations available in May were largely acted on before June.
Limitations
- Detailed breakdown data for a newly created cost management group usually appears within an hour of creation; it is not available immediately.
- After the initial load, cost data refreshes once every 24 hours. Infrastructure changes — such as resizing instances or purchasing reservations — are reflected at the next refresh, not immediately.
- The Opportunity Profile and Detailed breakdown are limited to five fixed optimization categories: Advanced Rightsizing, Advanced Reservations, Basic Rightsizing, Basic Reservations, and Other Recommendations.
Troubleshooting
Savings tracker shows no data on a newly created cost group
Cause: Detailed breakdown data usually takes up to an hour to populate after a cost management group is created.
Fix: Wait up to an hour and reload the panel.A recent infrastructure change isn't reflected in the results
Cause: Data refreshes once every 24 hours after the initial load; changes such as resizing instances or purchasing reservations only appear at the next refresh cycle.
Fix: Wait for the next 24-hour refresh, then reload.Savings tracker doesn't appear in the Context menu ( ⋮ )
Cause: The signed-in user's role doesn't include Read access to Analysis, Rightsizing, Reservations, and Other Recommendations.
Fix: Confirm the user has one of the built-in roles (Account owner, Contributor, Reader) or a custom role with the required permissions.Period A and Period B figures don't appear directly comparable
Cause: The two periods are billed in different currencies.
Fix: This is expected — Savings tracker automatically converts one period's values into the other period's currency. Confirm which currency is being used as the comparison baseline.
FAQs
Do Period A and Period B need to be consecutive months?
No. You can select any two calendar months for comparison; they don't need to be adjacent.What does a neutral (—) change mean in the Detailed breakdown?
It means there was no movement in unrealized savings for that category between the two selected periods.Can I export the Savings tracker view?
Yes. Use Download as PDF in the top-right corner of the panel to generate a PDF of the full view immediately.
Related articles
Was this article helpful?