

SQL Database
- 05 Aug 2026
- 5 Minutes to read
- Print
- DarkLight
- Download PDF
SQL Database
- Updated on 05 Aug 2026
- 5 Minutes to read
- Print
- DarkLight
- Download PDF
Article summary
Did you find this summary helpful?
Thank you for your feedback!
Overview
Azure SQL Database is a general-purpose relational database-as-a-service (DBaaS) built on the latest stable version of the Microsoft SQL Server Database Engine — a high-performance, dependable, and secure cloud database for building data-driven applications without managing infrastructure.
Business value
Running and saving SQL queries across multiple databases from Turbo360, instead of switching between database management tools and servers, reduces the time needed to investigate cross-database issues such as error logs spread across several servers.
How it works
- Once a SQL Database is associated with a Business Application, you can execute SQL queries against it directly from Turbo360, without a separate database management tool.
- When multiple SQL databases from different servers are associated with the same Business Application, queries can be run across all of them without switching servers, and frequently used queries can be saved to avoid re-entering them.
Prerequisites
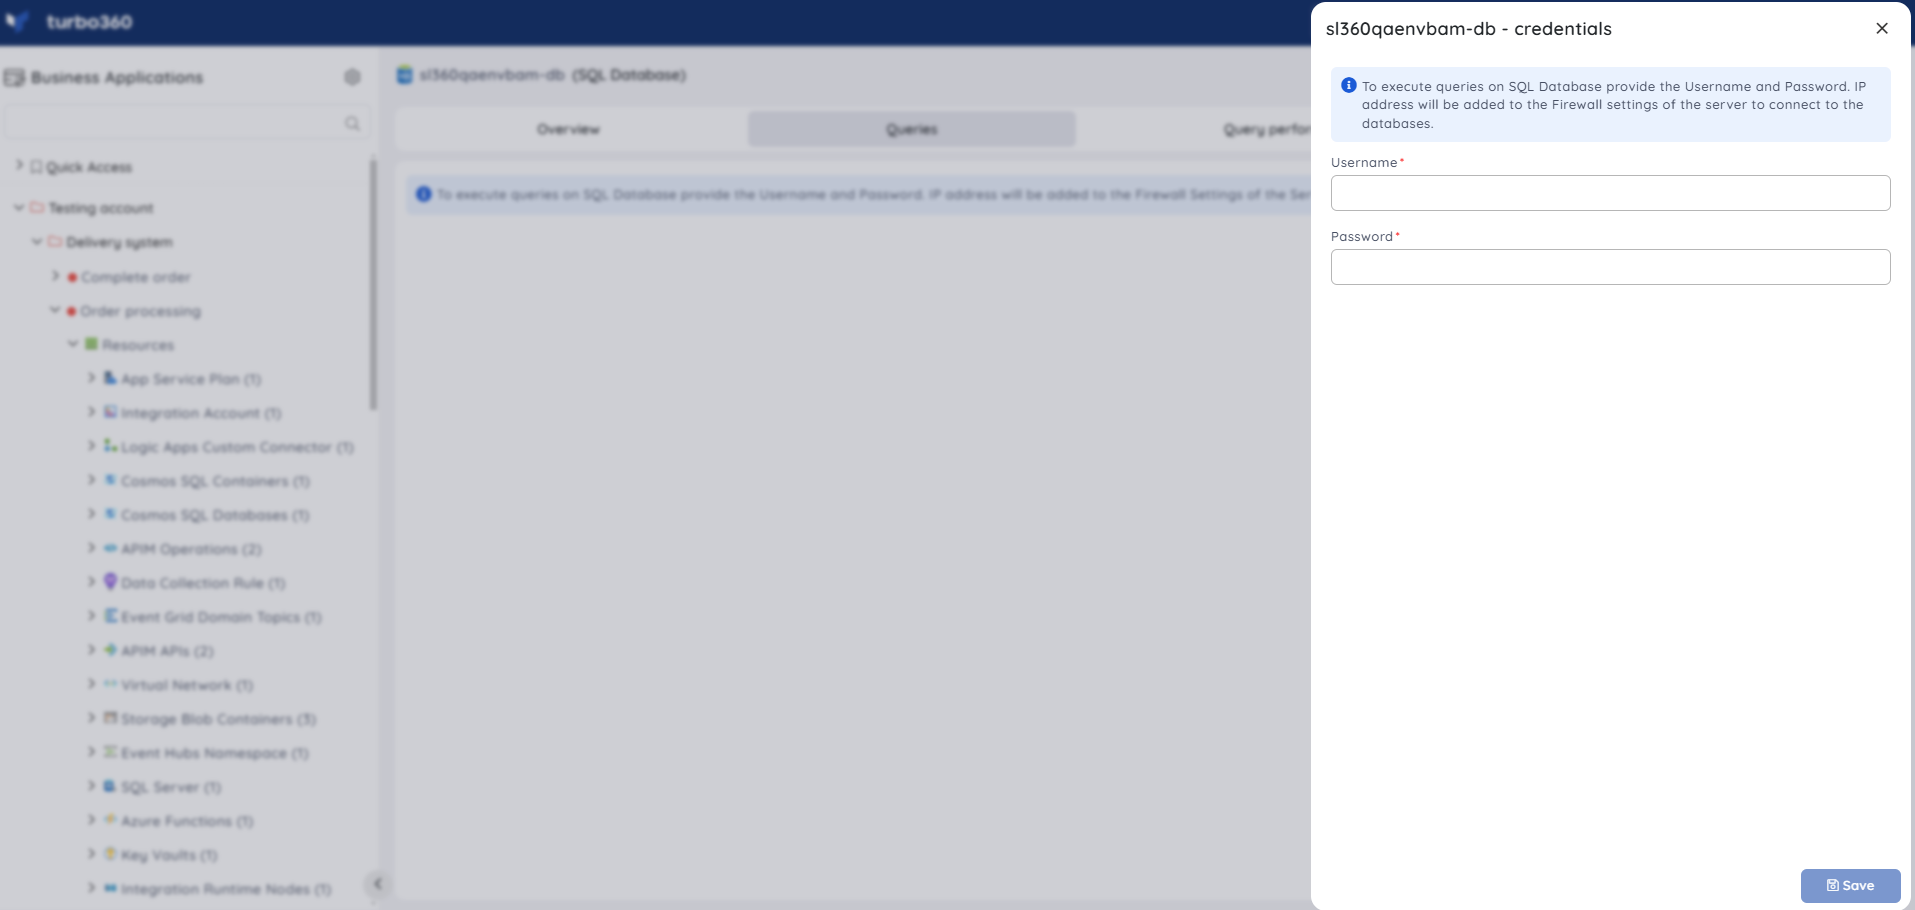
To execute queries on a SQL Database, you must authenticate with a Username and Password.
Note
Turbo360's IP address must be added to the server's Firewall Settings to allow the connection.
Permissions
Access to SQL Database actions is controlled through RBAC when adding a role to a Business Application.
| Permission | Description |
|---|---|
| Read | View dashboard, Query Performance Insight, and monitoring configuration. |
| Manage | Execute and save queries, in addition to all Read capabilities. |
Operations
Run and save SQL queries, and review query performance insights, directly from Turbo360.
Run queries
- Execute query — run SQL queries against the database without switching to a database management tool. Use this when you need to check data across multiple databases without changing tools or servers.
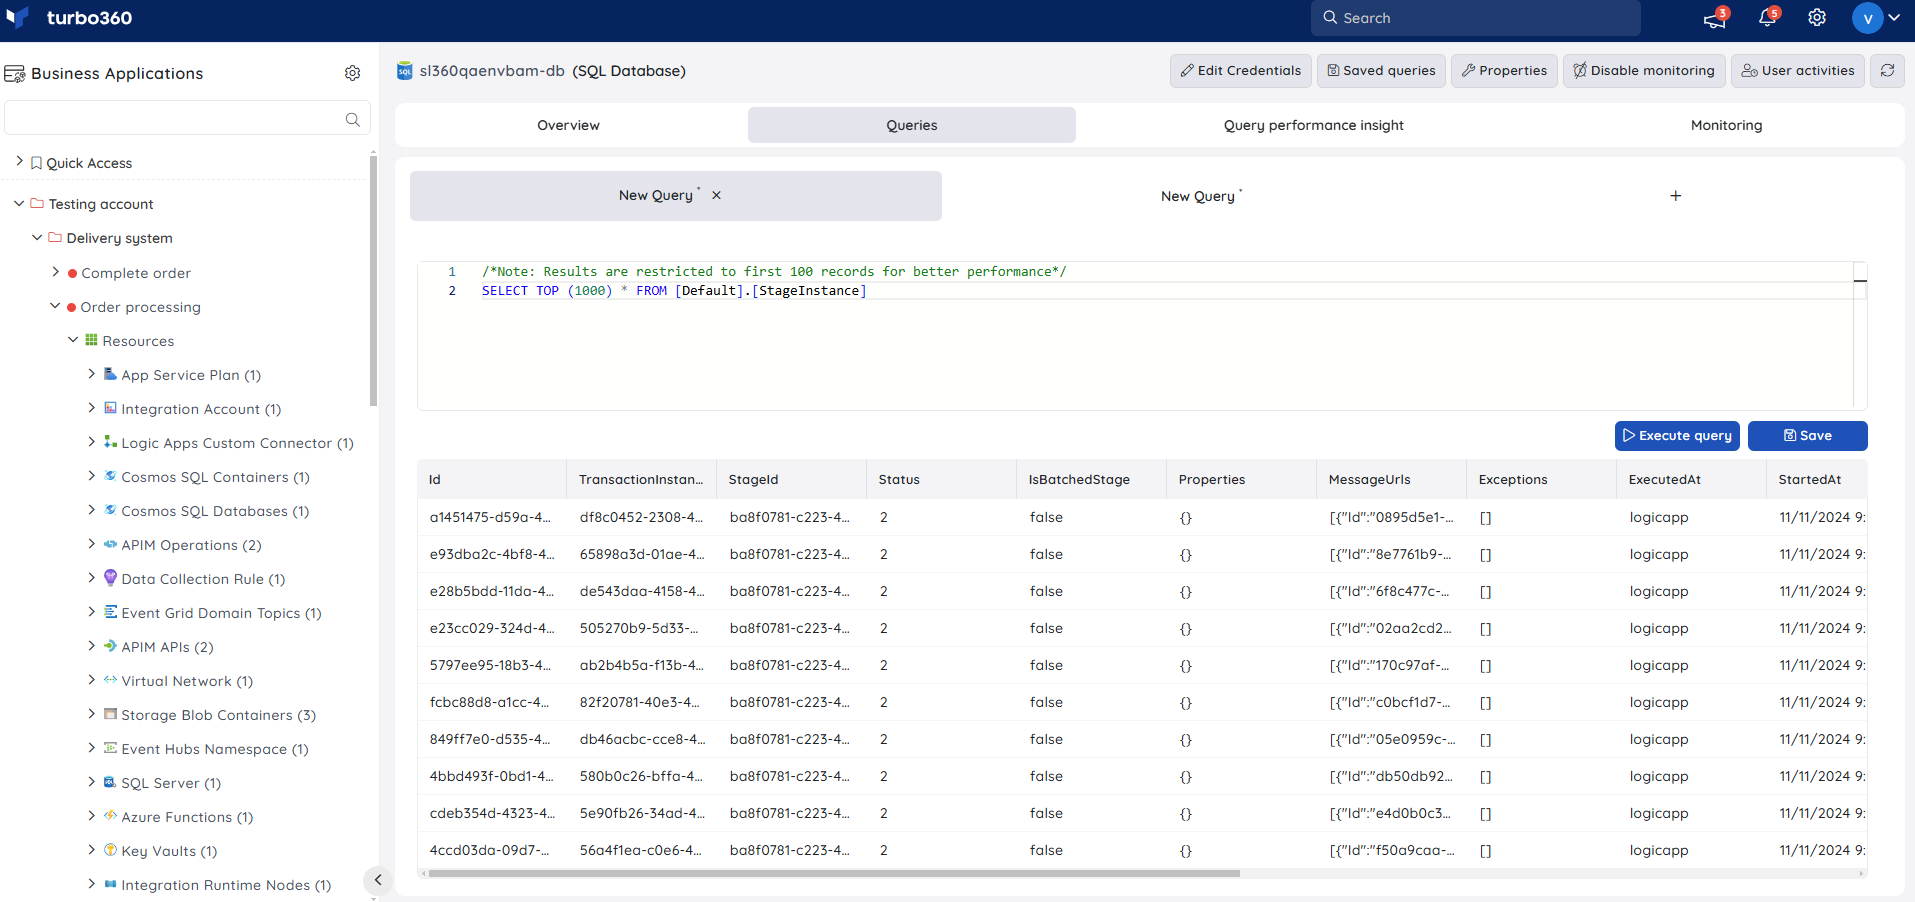
- Save frequently used queries — save a query for reuse so it doesn't need to be re-entered each time.
Query performance insight
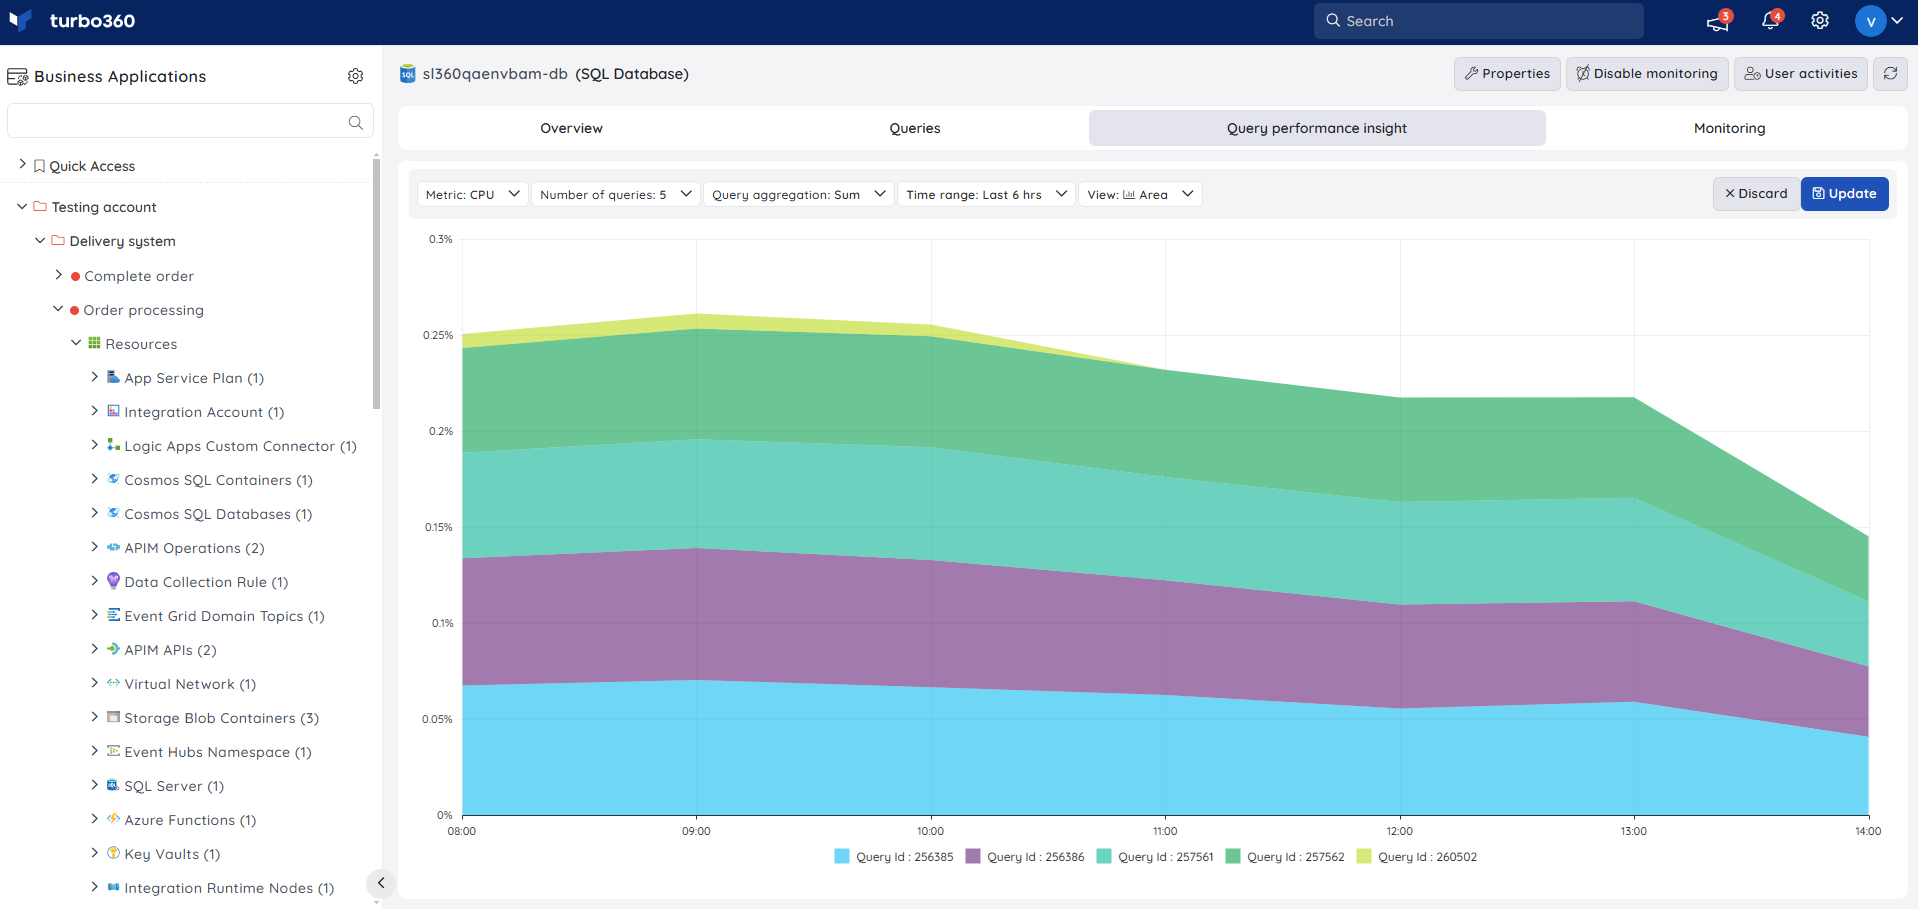
Query performance insight (QPI) surfaces the Top 5, 10, or 20 queries based on CPU, Data IO, Log IO, Duration, or Execution Count. Use this when you need to identify which queries are consuming the most resources on a database.
Resource dashboard
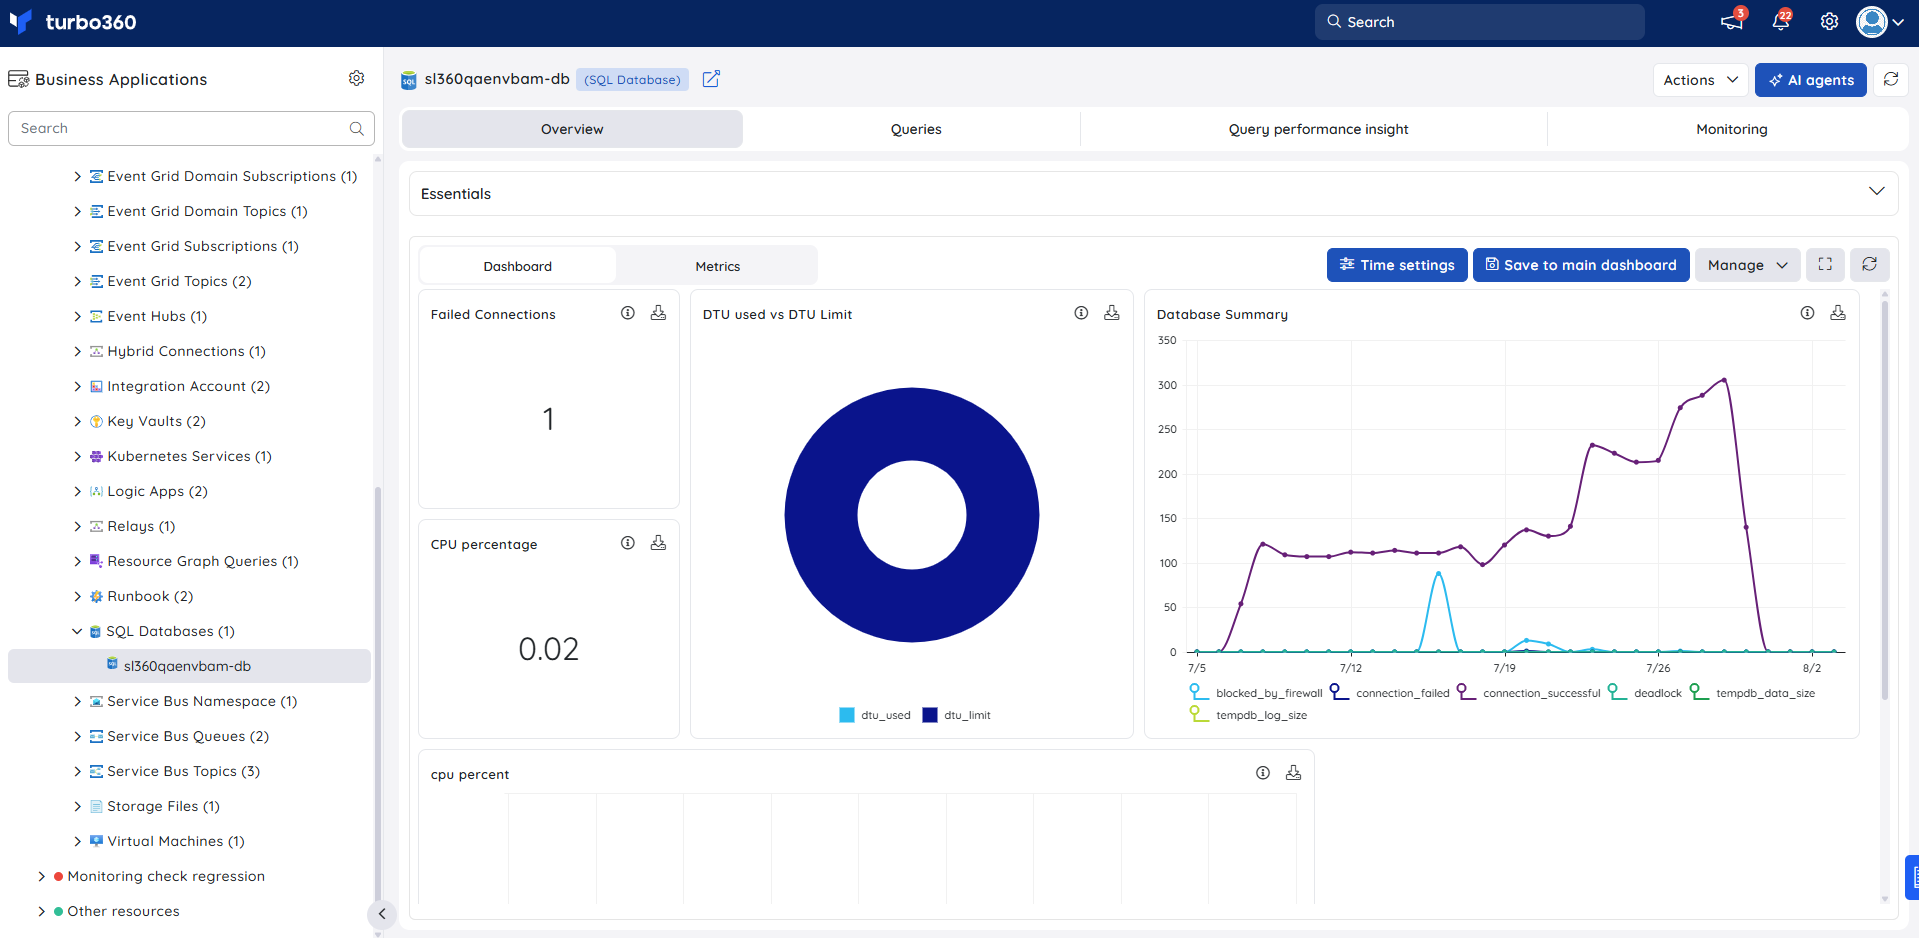
The dashboard surfaces connection, throughput, and CPU signals so you can assess database health without leaving Turbo360.
| Widget | What it shows |
|---|---|
| Failed Connections | Count of failed connection attempts to the database. |
| DTU used vs DTU Limit | Compares current DTU consumption against the provisioned DTU limit. |
| Database Summary | At-a-glance summary of database activity. |
| CPU percentage | Current CPU utilization of the database. |
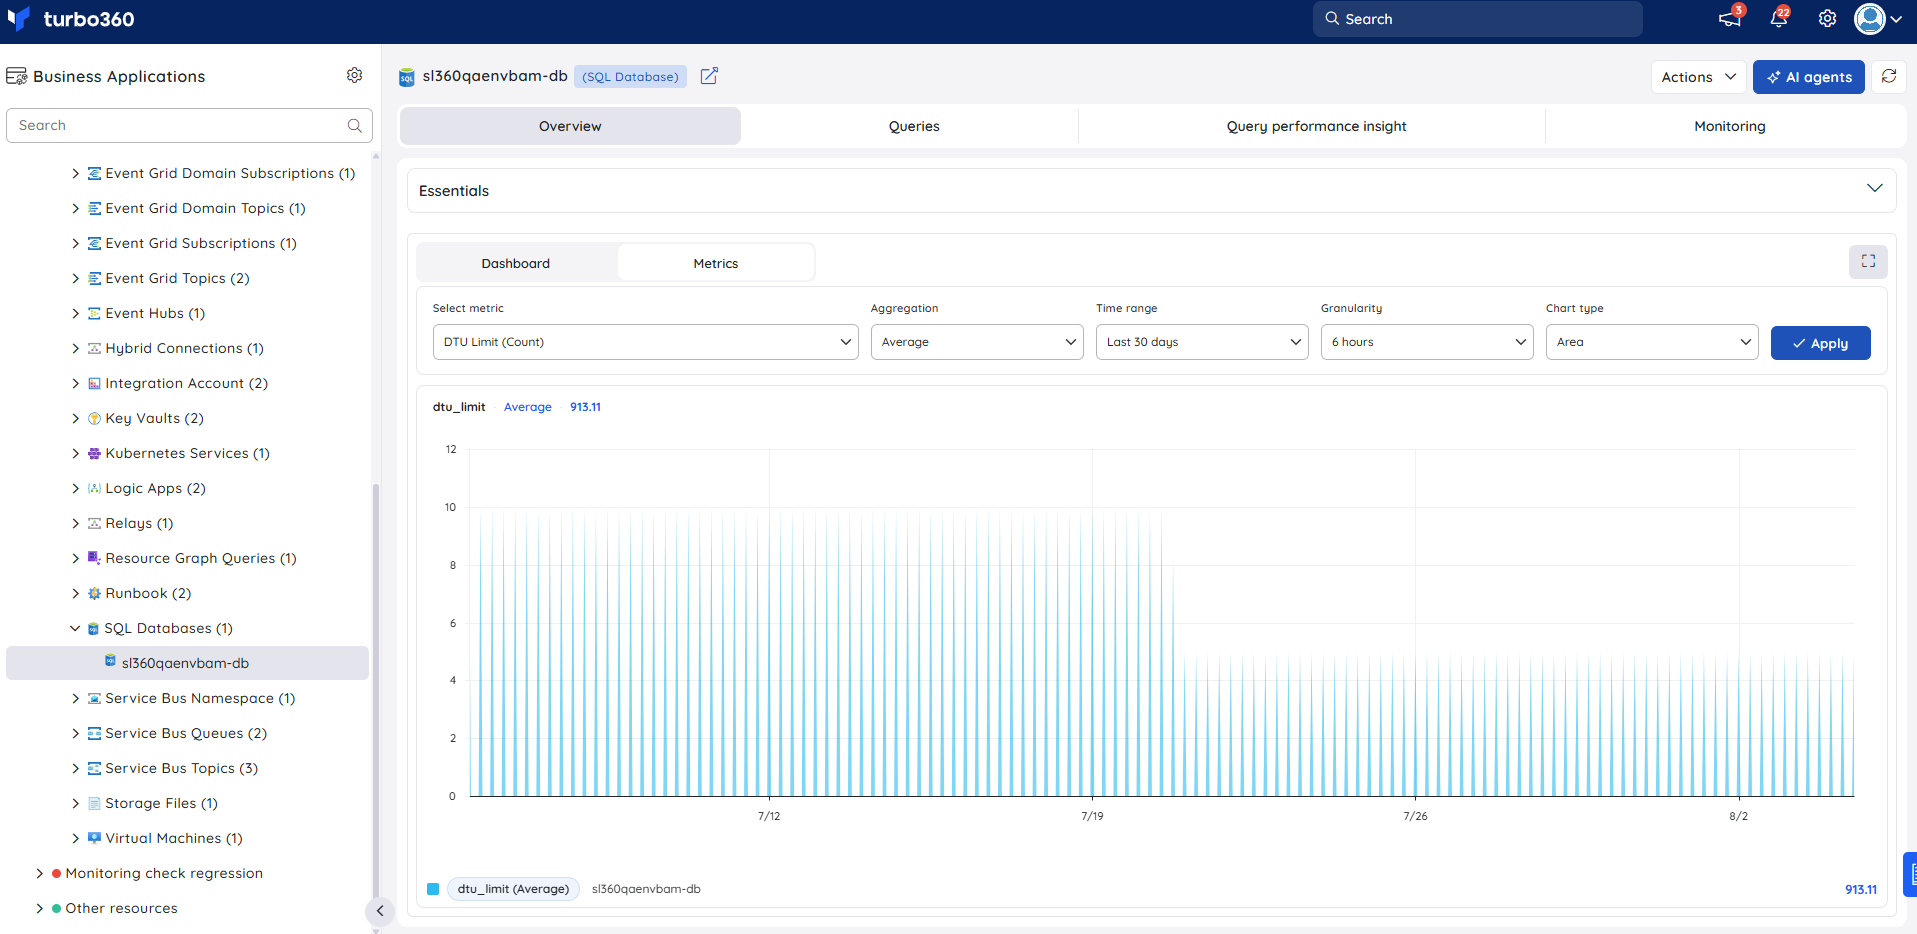
Metrics
The Metrics tab surfaces connection, DTU, and CPU data for SQL Database, giving you visibility into database performance trends over time. Use the Metrics tab to correlate spikes in failed connections or CPU utilization with application errors, and to confirm that performance returns to baseline after scaling events or query optimizations.
You can add, remove, or reconfigure widgets to focus on the metrics most relevant to your support scenario.
Monitoring
SQL Database supports availability status and metric monitoring rules, configured under SQL Database -> Monitoring.
Monitoring rules are saved per resource, and the monitoring state is reflected after every monitoring cycle.
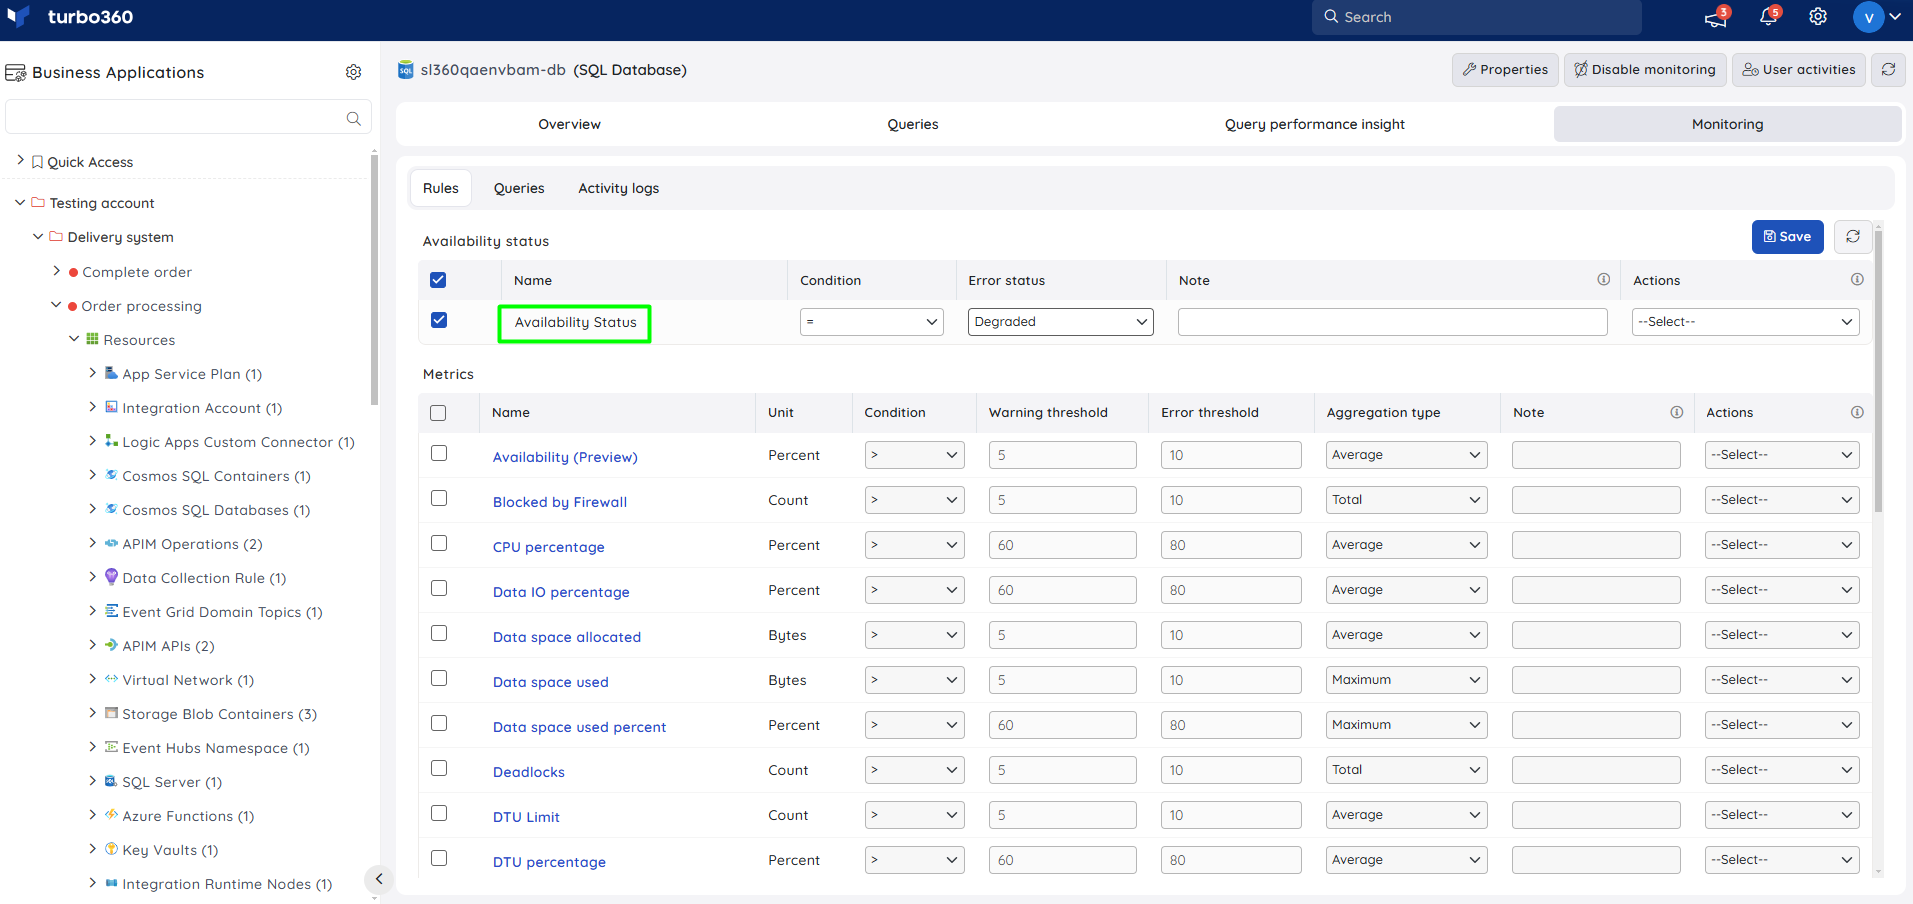
Availability status monitoring
Tracks the resource health status of the SQL Database. Use this when you need to be alerted as soon as the database becomes unavailable or degraded.
- Navigate to SQL Database -> Monitoring.
- Configure Availability status with the desired threshold.
- Click Save.
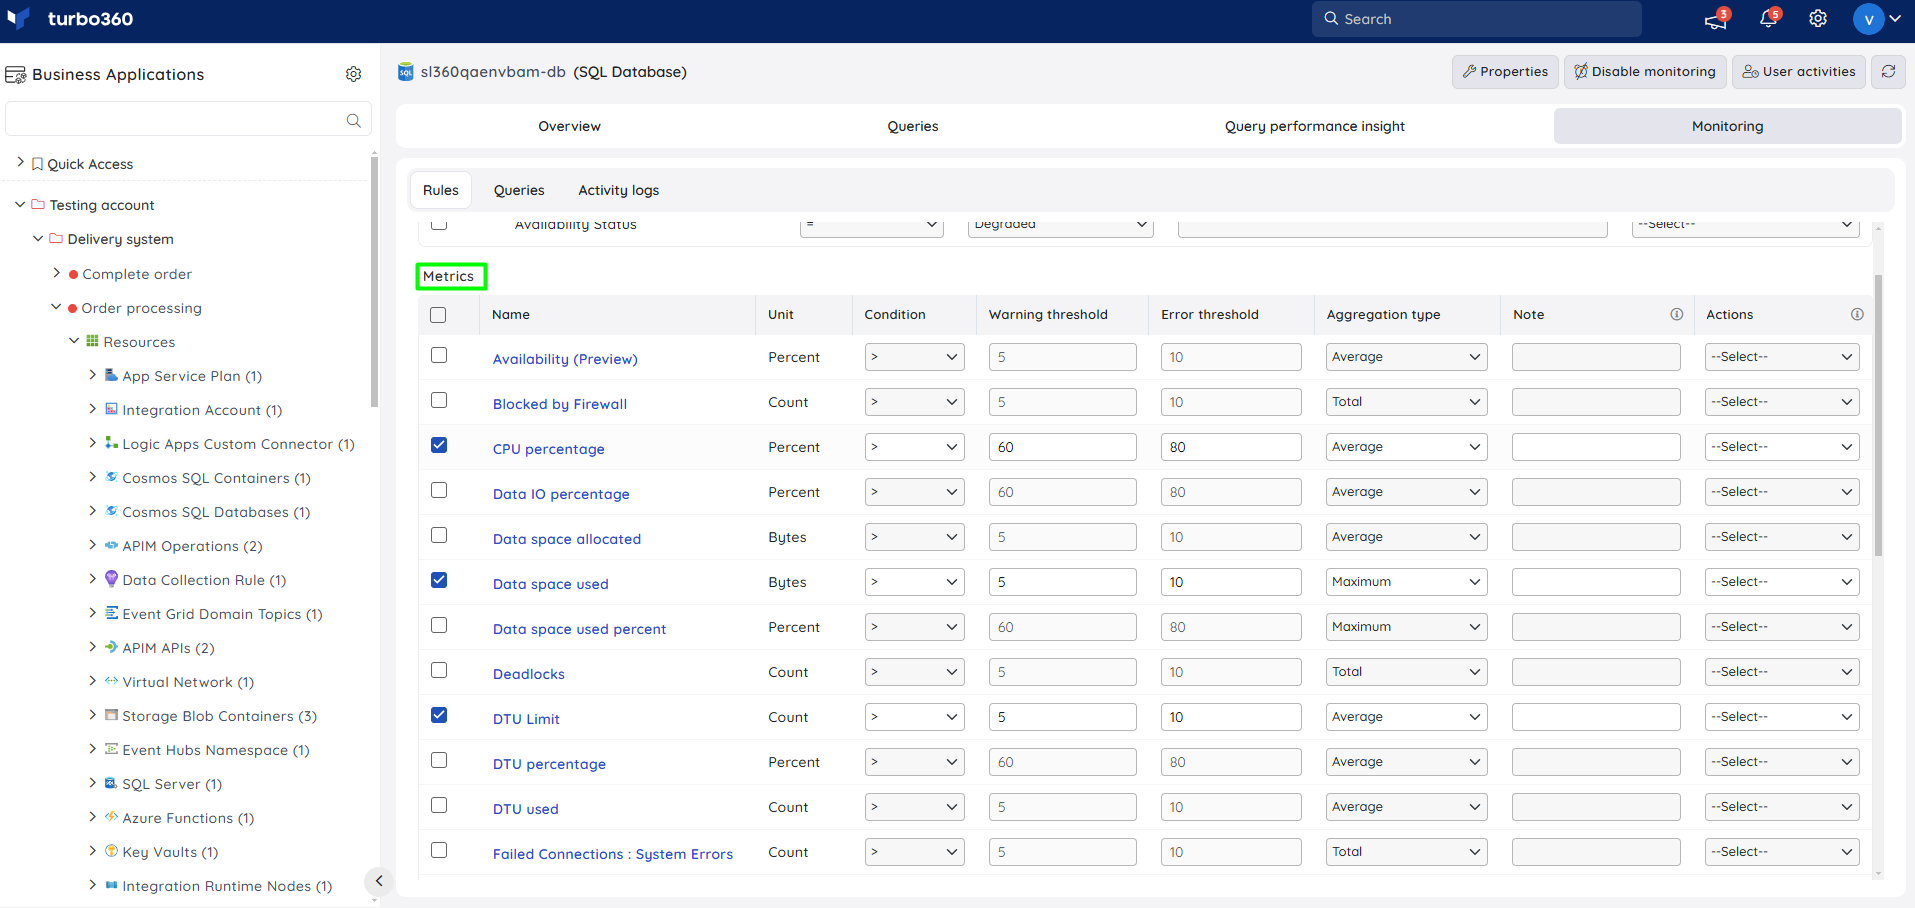
Metric monitoring
Tracks database metrics against a configured threshold; the rule is violated when the metric value meets the threshold.
- Navigate to SQL Database -> Monitoring.
- Select the necessary monitoring metrics and configure the threshold values.
- Click Save.
Monitoring recommendations
When monitoring your Azure SQL Database there are a number of metrics available which indicate how your database might be performing.
DTU Model
| Metric | Warning | Error |
|---|---|---|
| DTU Percentage | 90 | 95 |
DTU percentage applies to the DTU billing model and is a combo of other counters which represent the performance of the database.
vCore Model
| Metric | Warning | Error |
|---|---|---|
| CPU percentage | 90 | 95 |
| Data IO percentage | 90 | 95 |
| Data space used percent | 90 | 95 |
| Log IO percentage | 90 | 95 |
| SQL instance CPU percent | 90 | 95 |
| SQL instance memory percent | 90 | 95 |
| SQL Server process core percent | 90 | 95 |
| SQL Server process memory percent | 90 | 95 |
| Tempdb Percent Log Used | 90 | 95 |
The recommendations here are a guide for an application that is configured on Azure with appropriate scaling. There are a number of different scenarios which you can configure, so we recommend discussing the monitoring with your DBA and application developers to make sure the settings are appropriate for your application's expected behaviour.
Connection monitoring — if you want to monitor the connections to your database, the following metrics are useful:
- Successful Connections — can be used to monitor for the expected max number of connections to detect scenarios where you might have a concern of an attack on your database. This counter would be used depending on how your application is configured to work.
- Failed Connections: User Errors — may indicate the application is having issues connecting to your database.
Log monitoring — if you are exporting your SQL Azure database logs to Log Analytics, the query library for Log Analytics monitoring in Turbo360 includes queries that can be used with SQL Azure Database.
More info — see Microsoft's monitoring metrics and alerts documentation for further detail on these metrics.
Troubleshooting
- Query execution fails with a connection error
Cause: Turbo360's IP address has not been added to the server's Firewall Settings, or the provided credentials are incorrect.
Fix: Confirm Turbo360's IP is allow-listed on the server firewall and re-verify the Username and Password. - Saved query no longer returns expected results
Cause: The underlying table or schema has changed since the query was saved.
Fix: Review and update the saved query to match the current schema. - Availability status monitoring shows the database as unavailable despite it being reachable
Cause: The configured threshold or connectivity path used for the check doesn't match the actual network path to the database.
Fix: Verify the threshold configuration and confirm Turbo360 can reach the database over the same path used by applications. - Metric monitoring rule doesn't trigger as expected
Cause: The threshold doesn't account for the billing model (DTU vs vCore) the database actually uses.
Fix: Confirm which billing model applies and use the corresponding metric set and thresholds from the Monitoring recommendations.
Related articles
- [NEEDS VERIFICATION: SQL Elastic Pool — no article found in KB]
- Storage Account
- Rules configuration
Was this article helpful?