

Storage Account
- 05 Aug 2026
- 2 Minutes to read
- Print
- DarkLight
- Download PDF
Storage Account
- Updated on 05 Aug 2026
- 2 Minutes to read
- Print
- DarkLight
- Download PDF
Article summary
Did you find this summary helpful?
Thank you for your feedback!
Overview
Azure Storage Account is a common resource that participates in many solutions — sometimes indirectly, such as underpinning a SQL Database or Function App, and sometimes directly, such as storing business data.
Business value
Monitoring a Storage Account within the context of the Business Application it supports, rather than as an isolated Azure resource, makes it easier to spot storage-related issues that affect a specific application.
How it works
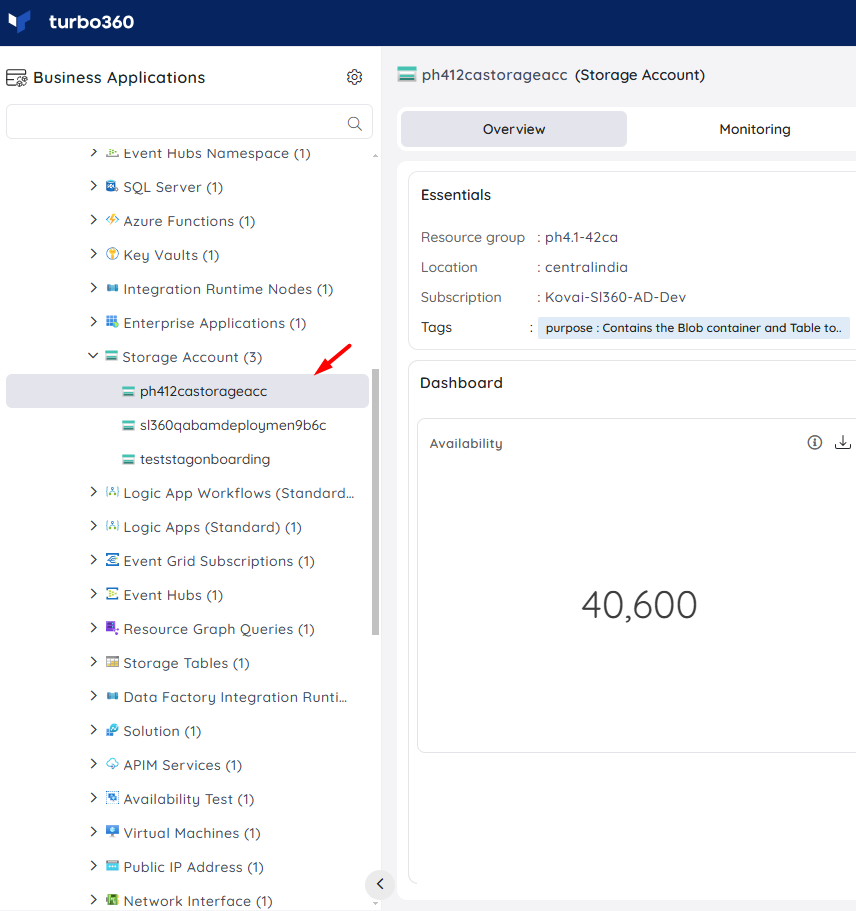
Once a Storage Account is associated with a Business Application, you can monitor it within the context of that application rather than checking it in isolation in the Azure portal.
Permissions
Access to Storage Account actions is controlled through RBAC when adding a role to a Business Application.
| Permission | Description |
|---|---|
| Read | View dashboard and monitoring configuration. |
| Manage | Configure monitoring rules, in addition to all Read capabilities. |
Resource dashboard
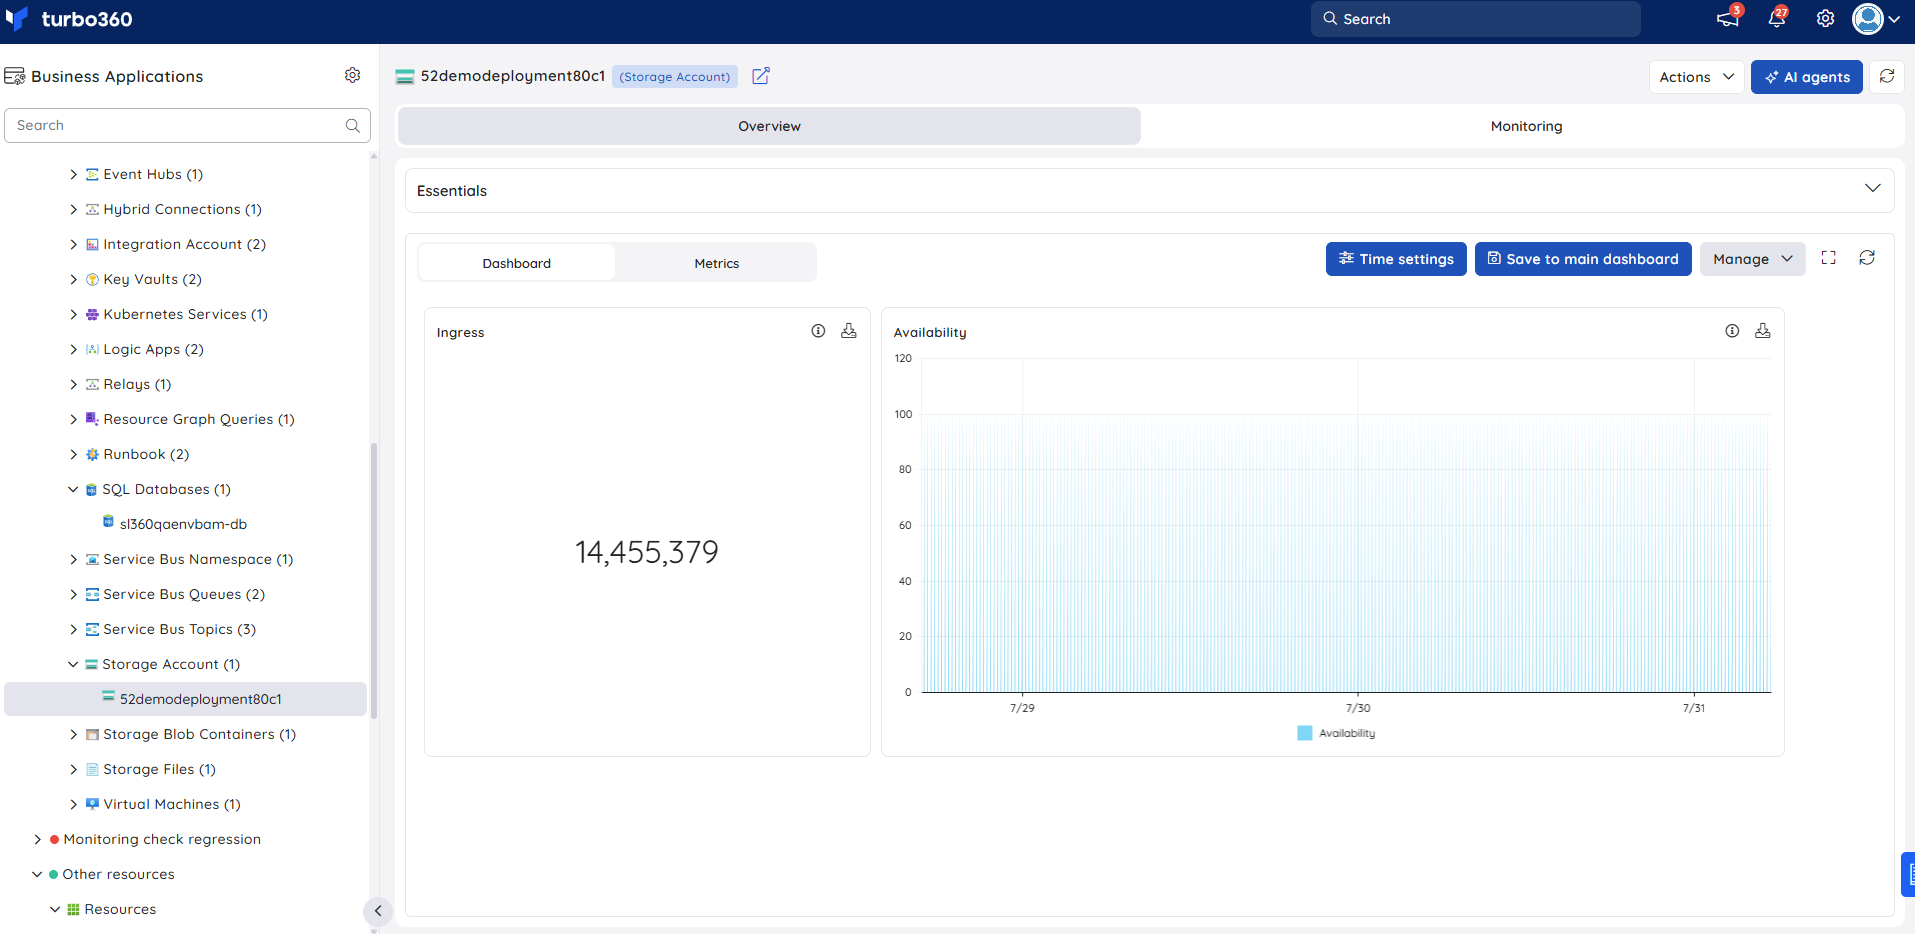
The dashboard lets you add custom widgets for your specific scenario — for example, surfacing IO and transactions so a support operator can quickly gauge how the storage account is being used.
Metrics
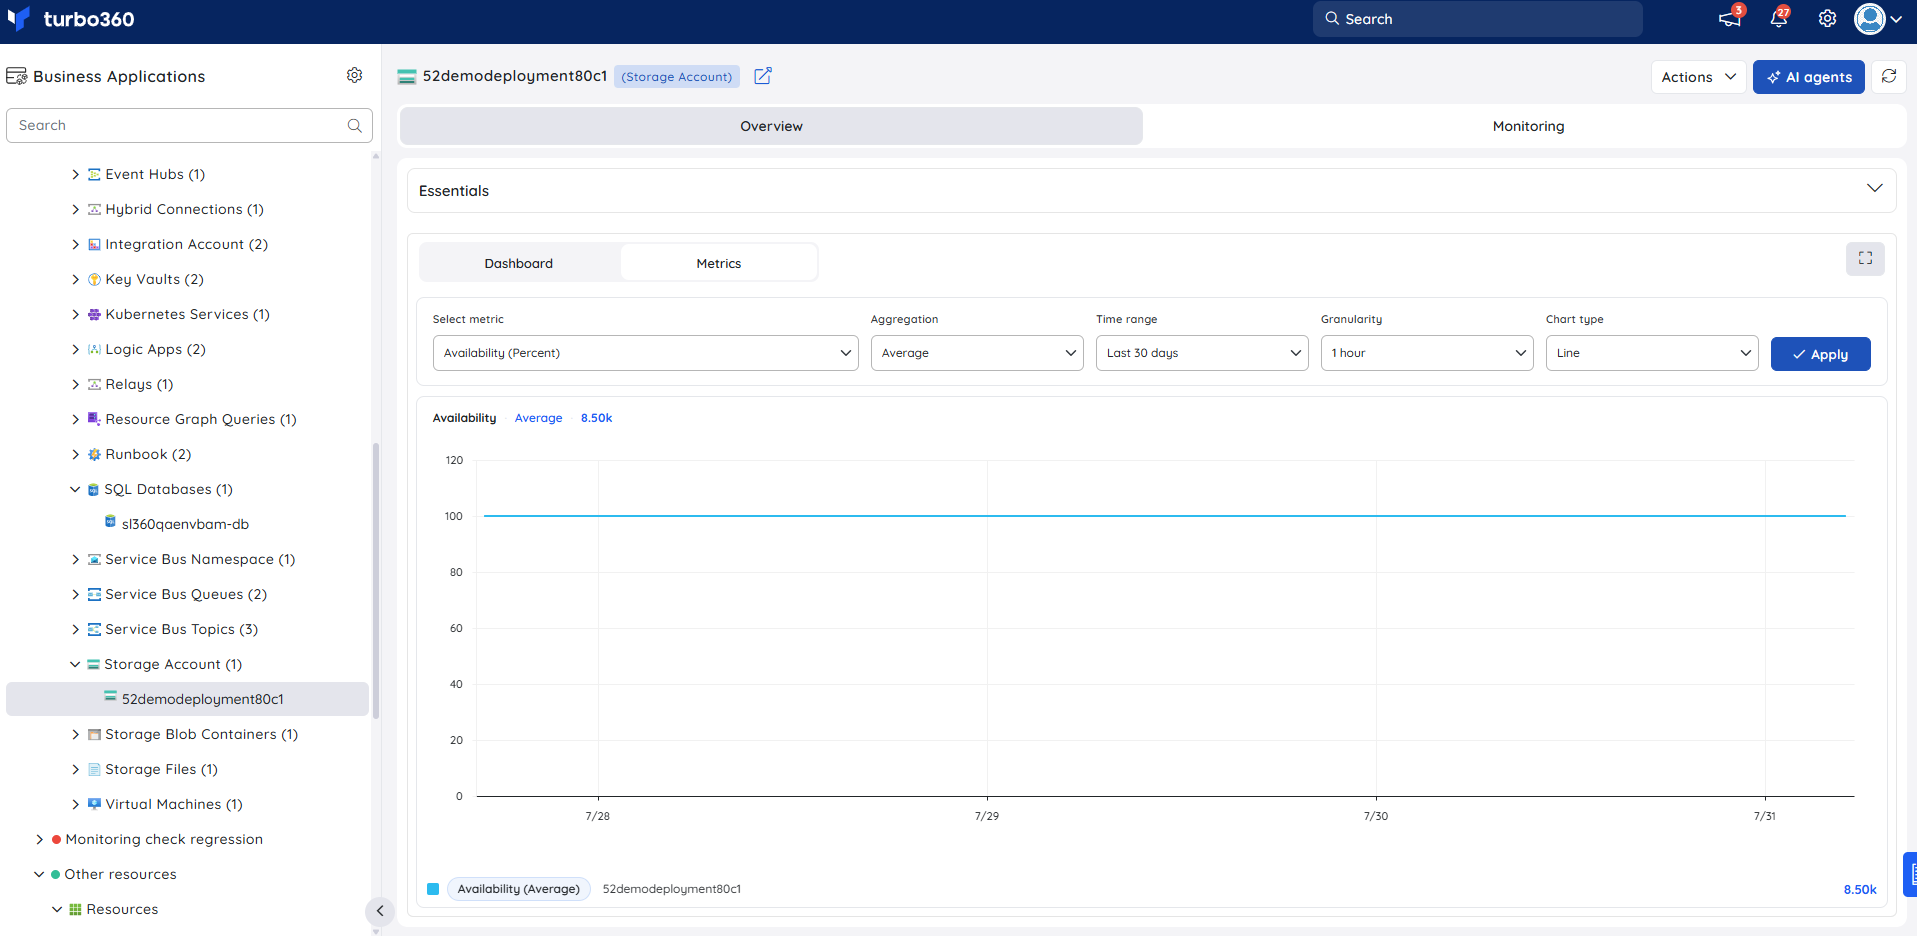
The Metrics tab surfaces availability, latency, and throughput data for Storage Account, giving you visibility into storage performance trends over time. Use the Metrics tab to detect sustained availability drops or rising latency that may indicate storage throttling or capacity pressure before they affect connected applications.
Monitoring
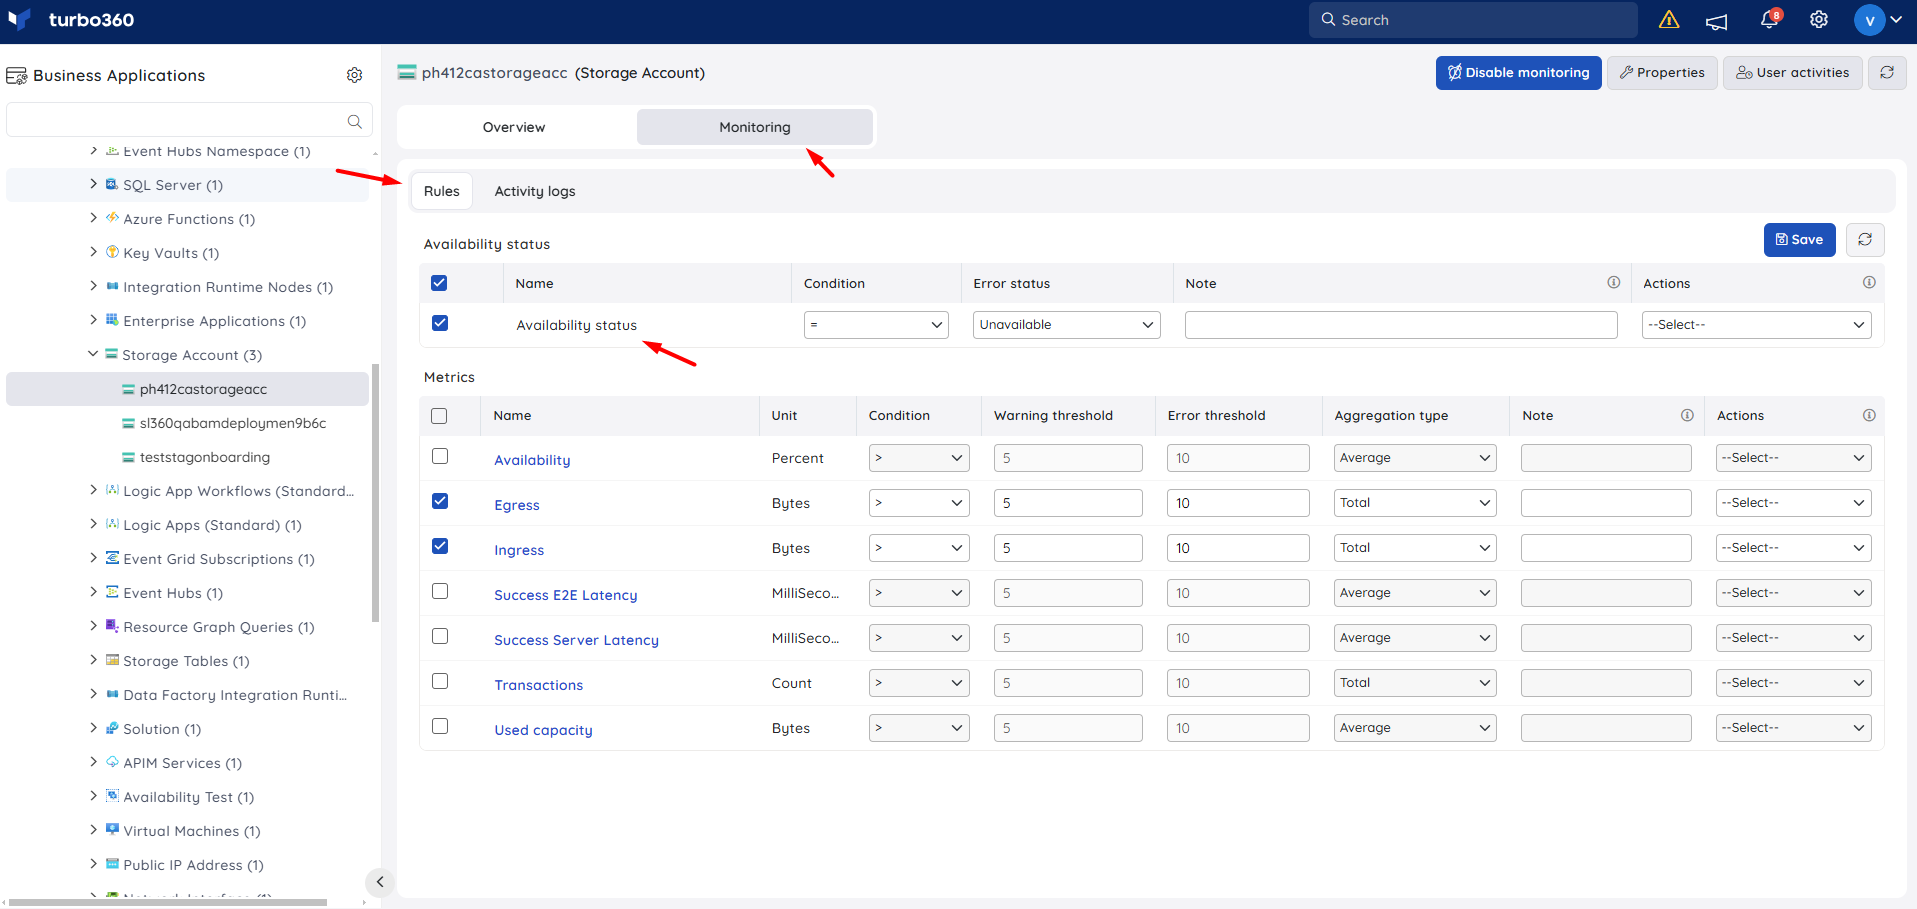
Monitoring is available for Storage Account metrics, configured from the Monitoring section of the resource.
Metric monitoring
Tracks Storage Account metrics against configured thresholds. Use this when you need to be alerted if availability or latency degrades.
Monitoring recommendations
Storage account monitoring recommendations mainly focus on ensuring the general health and responsiveness of the storage account.
Metrics — the common metrics to monitor:
| Metric | Warning Threshold | Error threshold |
|---|---|---|
| Availability | < 100 | < 99 |
| Success E2E Latency | > 50ms | > 75ms |
| Success Server Latency | > 50ms | > 75ms |
Points to note:
- Availability is a good general counter to indicate that applications should be able to access your storage account — look for this counter to be 100%.
- The two latency counters indicate how the storage account is processing your files; the more heavily used your storage account is, the more likely this counter is to increase.
There are other metrics that can be monitored, such as transactions, data IO, and capacity. The value of monitoring these depends on how your application typically behaves — it's best to review with the application developers whether it's worth monitoring these counters for your scenario.
More info — see Microsoft's monitoring and tuning overview for further detail.
Troubleshooting
- Dashboard widgets show no data after associating the Storage Account
Cause: The resource has not completed its first monitoring cycle since being added to the Business Application.
Fix: Wait for the next monitoring cycle, then refresh the dashboard. - Availability metric reports below 100% even though the storage account appears reachable
Cause: Transient throttling or a brief outage occurred during the measurement window.
Fix: Review the metric over a longer time range to distinguish a one-off dip from a sustained issue. - Latency counters trend upward over time
Cause: Increased load on the storage account from growing application usage.
Fix: Review the latency trend against usage patterns with the application developers, and consider scaling or redistributing load if it's sustained.
Related articles
Was this article helpful?