

Synapse Pipeline
- 05 Aug 2026
- 4 Minutes to read
- Print
- DarkLight
- Download PDF
Synapse Pipeline
- Updated on 05 Aug 2026
- 4 Minutes to read
- Print
- DarkLight
- Download PDF
Article summary
Did you find this summary helpful?
Thank you for your feedback!
Overview
Azure Synapse Analytics is an integrated platform service combining data warehousing, data integration, ETL pipelines, analytics, and visualization at big-data scale. A Synapse Workspace can have one or more pipelines — a cloud-based ETL and data integration tool for designing data-driven workflows that orchestrate data movement and transformation.
Business value
Managing Synapse Pipeline runs from Turbo360 lets you trigger, monitor, and recover pipeline executions in one place, reducing the time to detect and resolve failed activity runs without switching to Synapse Studio.
How it works
- A Synapse Pipeline run can fail due to a failure in any of its activities. Turbo360 lets you re-run single or multiple failed pipeline runs using their previously configured parameters.
- When a re-run completes, a tag is appended to the child run referencing the original activity run, and a tag on the parent run provides access to the run history of all its child runs.
Prerequisites
Synapse Administrator access is required at the Service Principal level before a Synapse Pipeline can be associated with a Business Application. Grant this in the Azure portal under Synapse workspace -> Synapse Studio.
See Synapse RBAC roles for more detail.
Permissions
Access to Synapse Pipeline actions is controlled through RBAC when adding a role to a Business Application.
| Permission | Description |
|---|---|
| Read | View pipeline runs, parameters, dashboard, and monitoring configuration. |
| Manage | Run a pipeline and configure monitoring rules. |
| Reprocess | Rerun failed pipeline runs, individually or in bulk. |
Operations
Turbo360 lets you run, monitor, and recover Synapse Pipeline executions directly, without switching to Synapse Studio.
Run pipeline
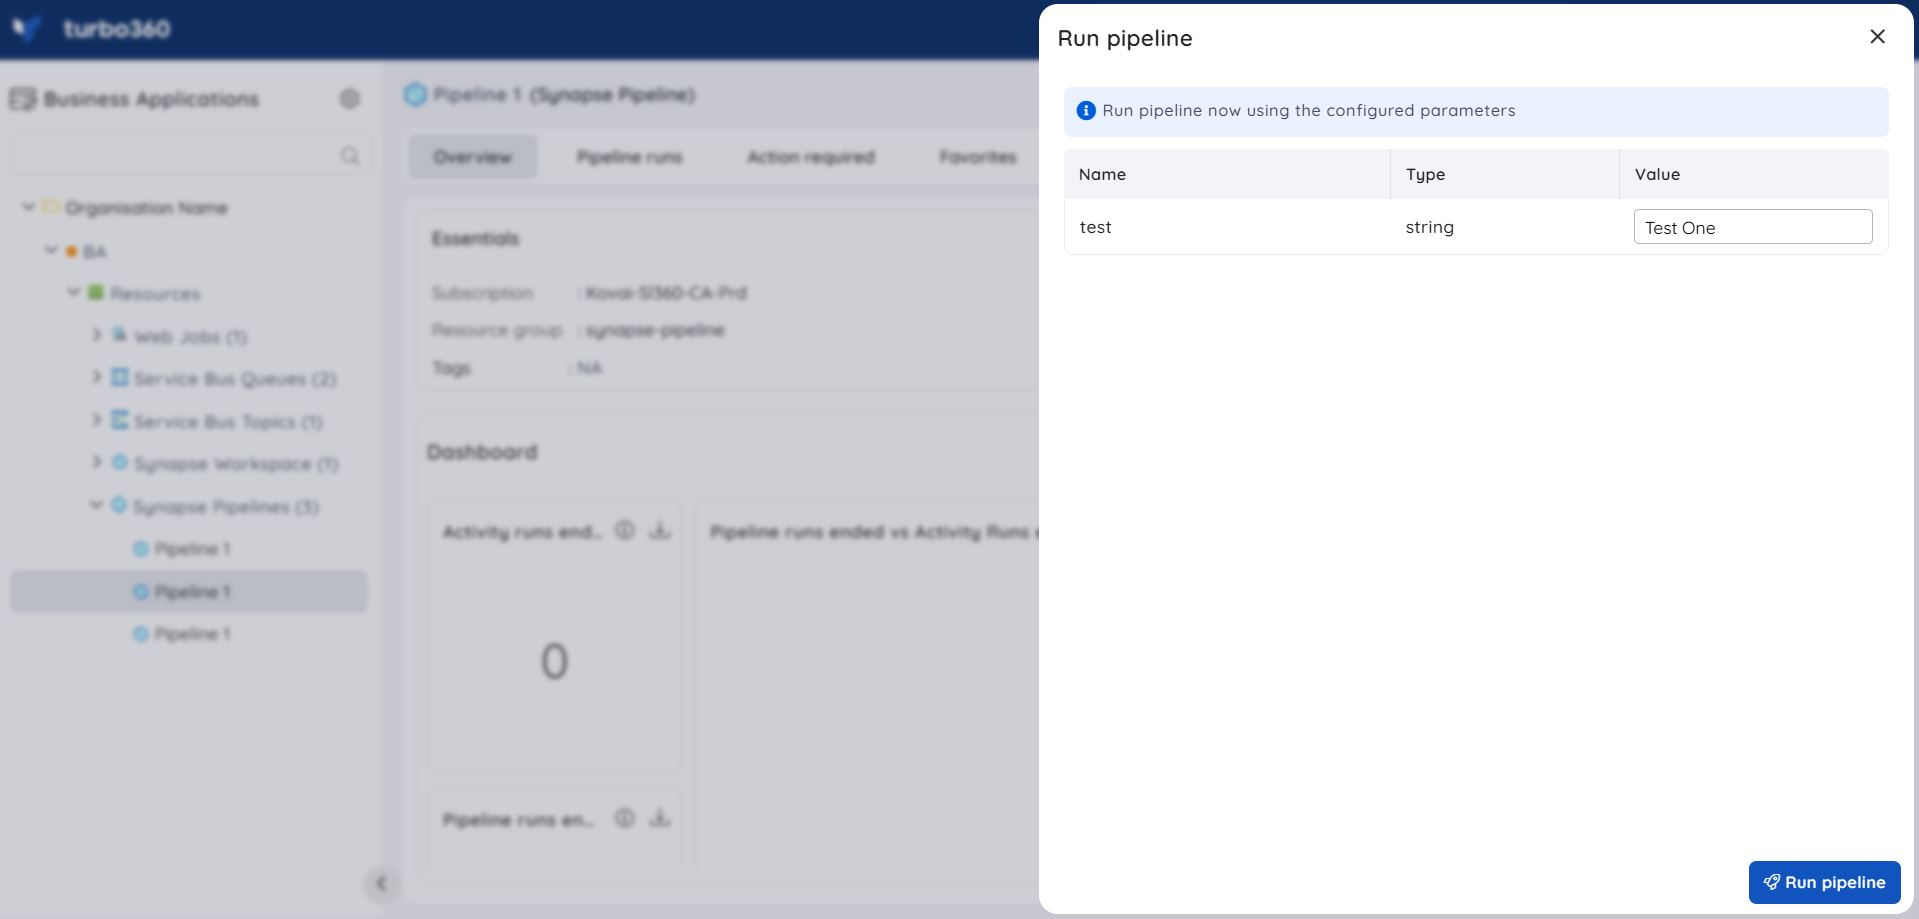
- Run pipeline — start a Synapse Pipeline by entering values for the parameters configured in the Azure portal.
Pipeline runs
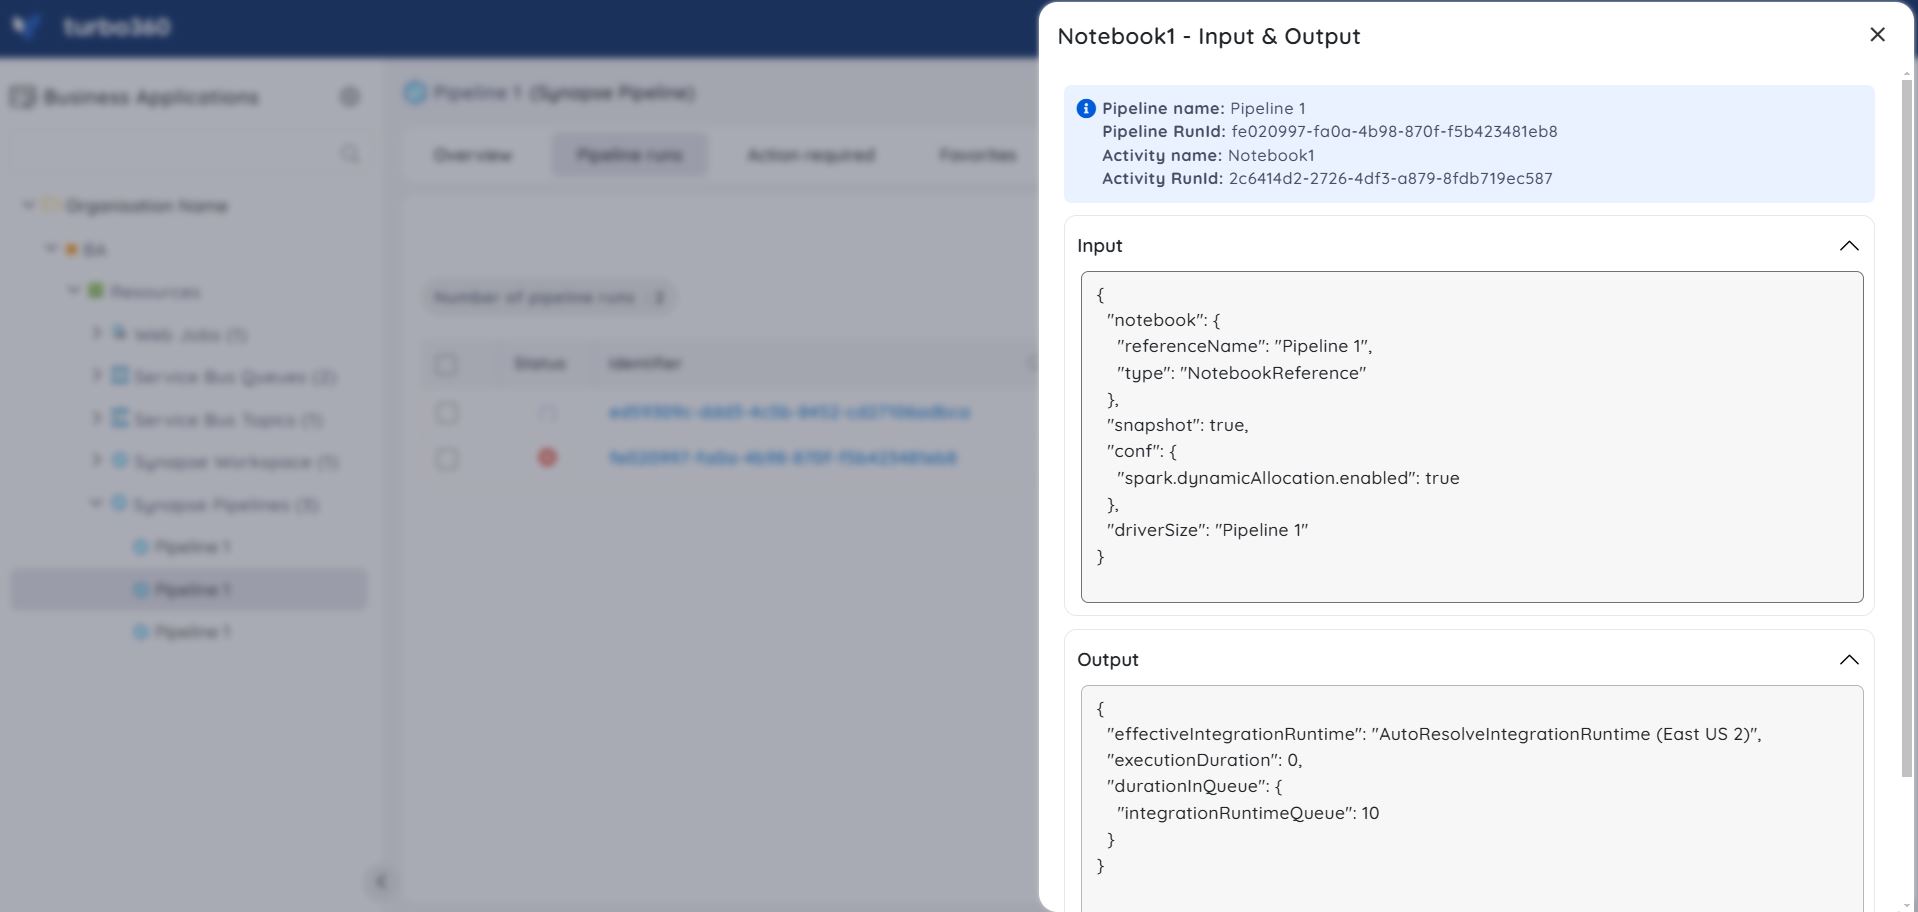
- View pipeline runs — view the pipeline runs of a Synapse pipeline along with their activity runs by clicking the corresponding pipeline identifier.
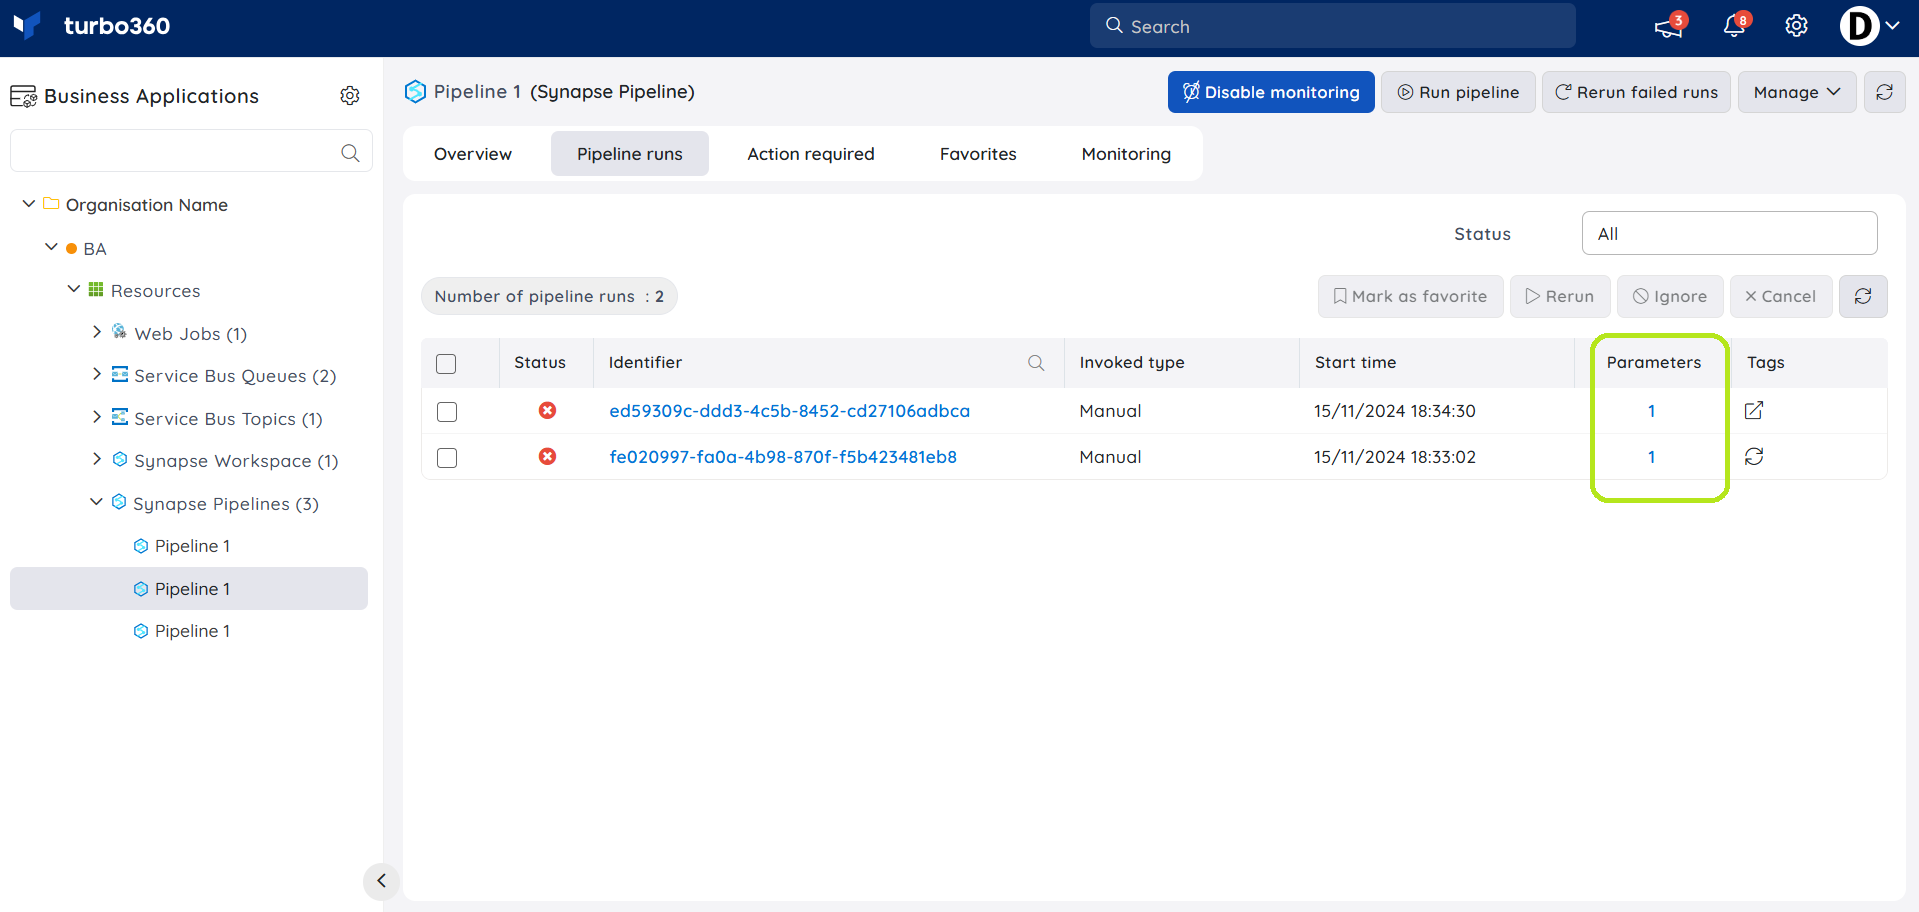
The parameters specified when triggering a run are shown in the Parameters column for that run.
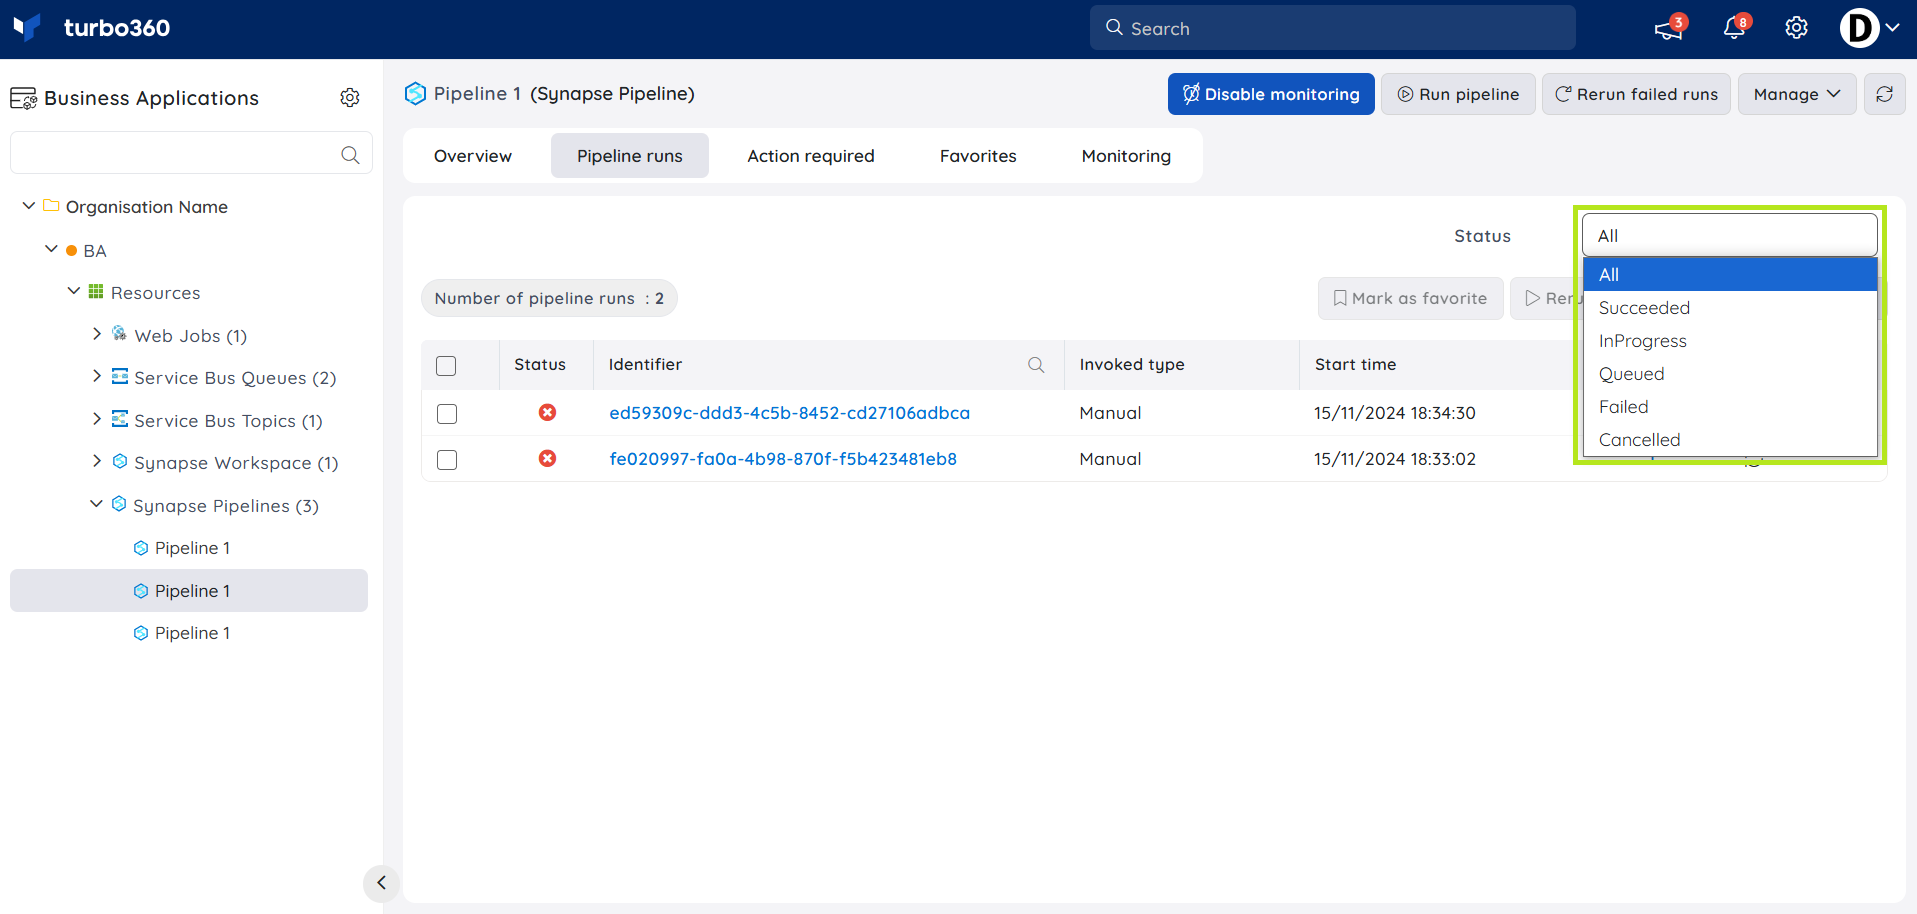
Runs can be filtered by status: Succeeded, In Progress, Queued, Failed, or Cancelled.
Rerun failed pipeline runs
- Rerun — rerun a single or multiple failed pipeline runs using their previously configured parameters. Use this when an activity failure needs to be retried without reconfiguring inputs.
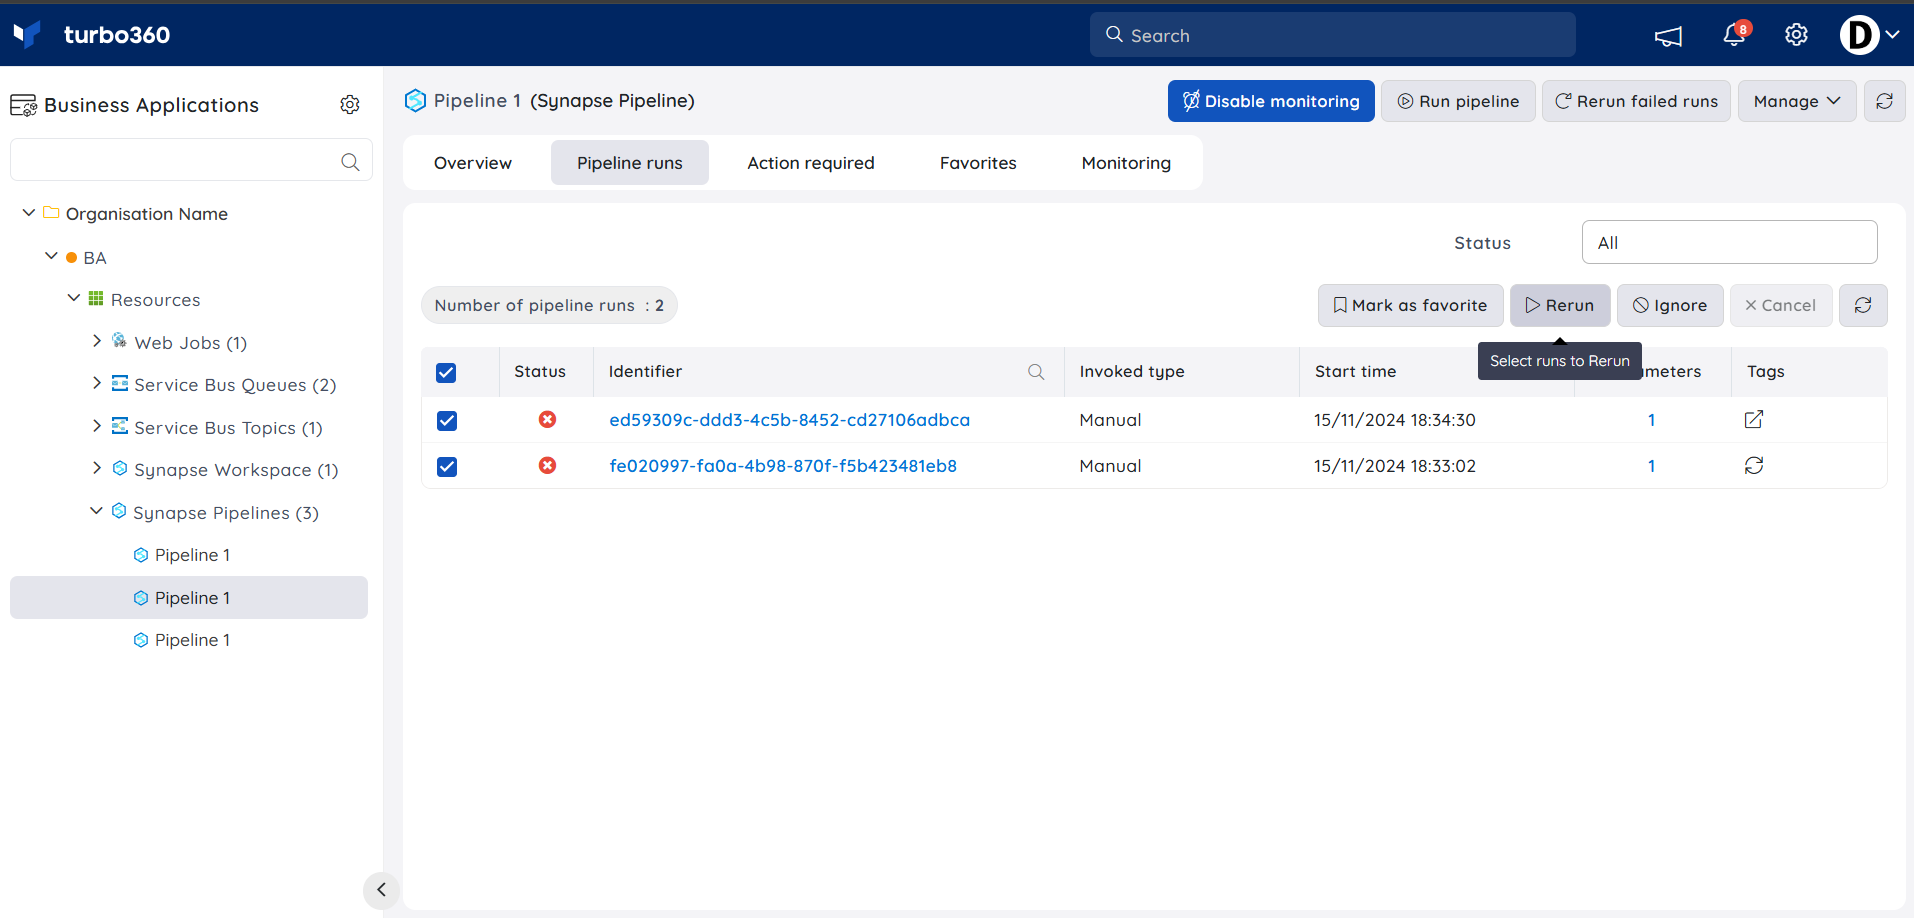
Stop pipeline run
- Cancel — interrupt any ongoing pipeline run.
Ignore pipeline run
- Ignore — mark a pipeline run as no longer requiring action; the run receives an ignore tag visible in the Tags column.
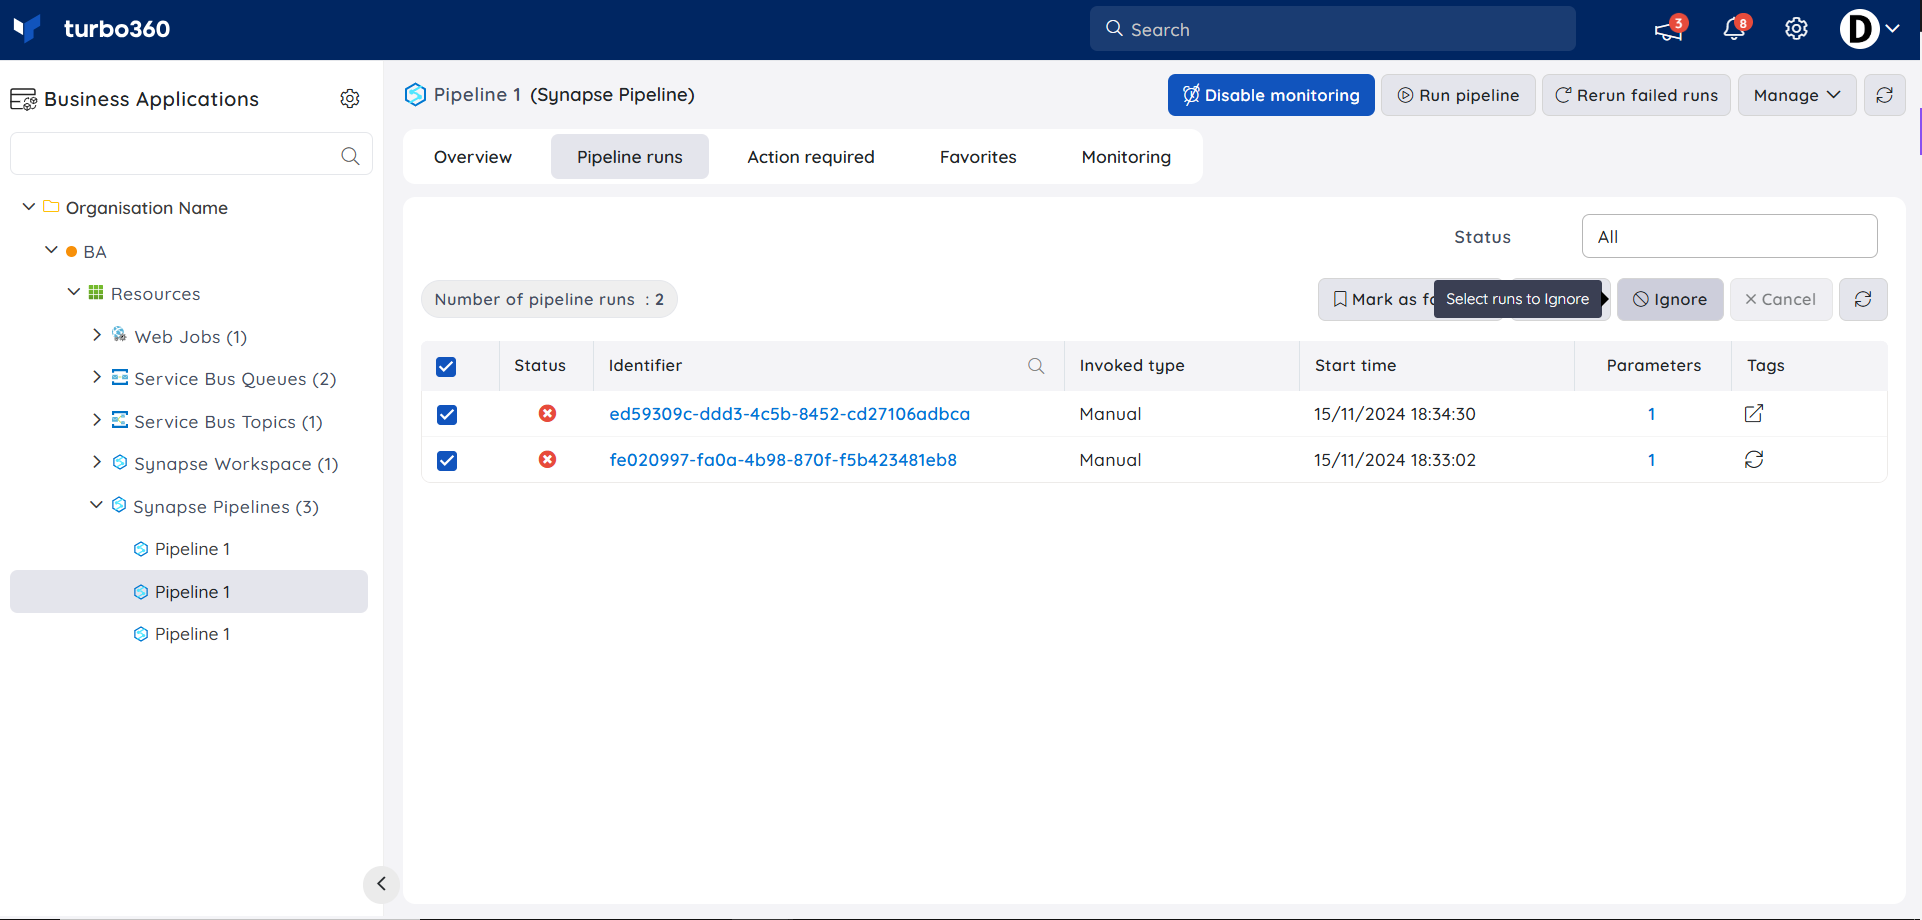
The ignore tag is only visible in Turbo360 and has no effect on actual runs.
Action Required
- Action Required — view all failed pipeline runs that require action, and ignore or rerun them from the same view.
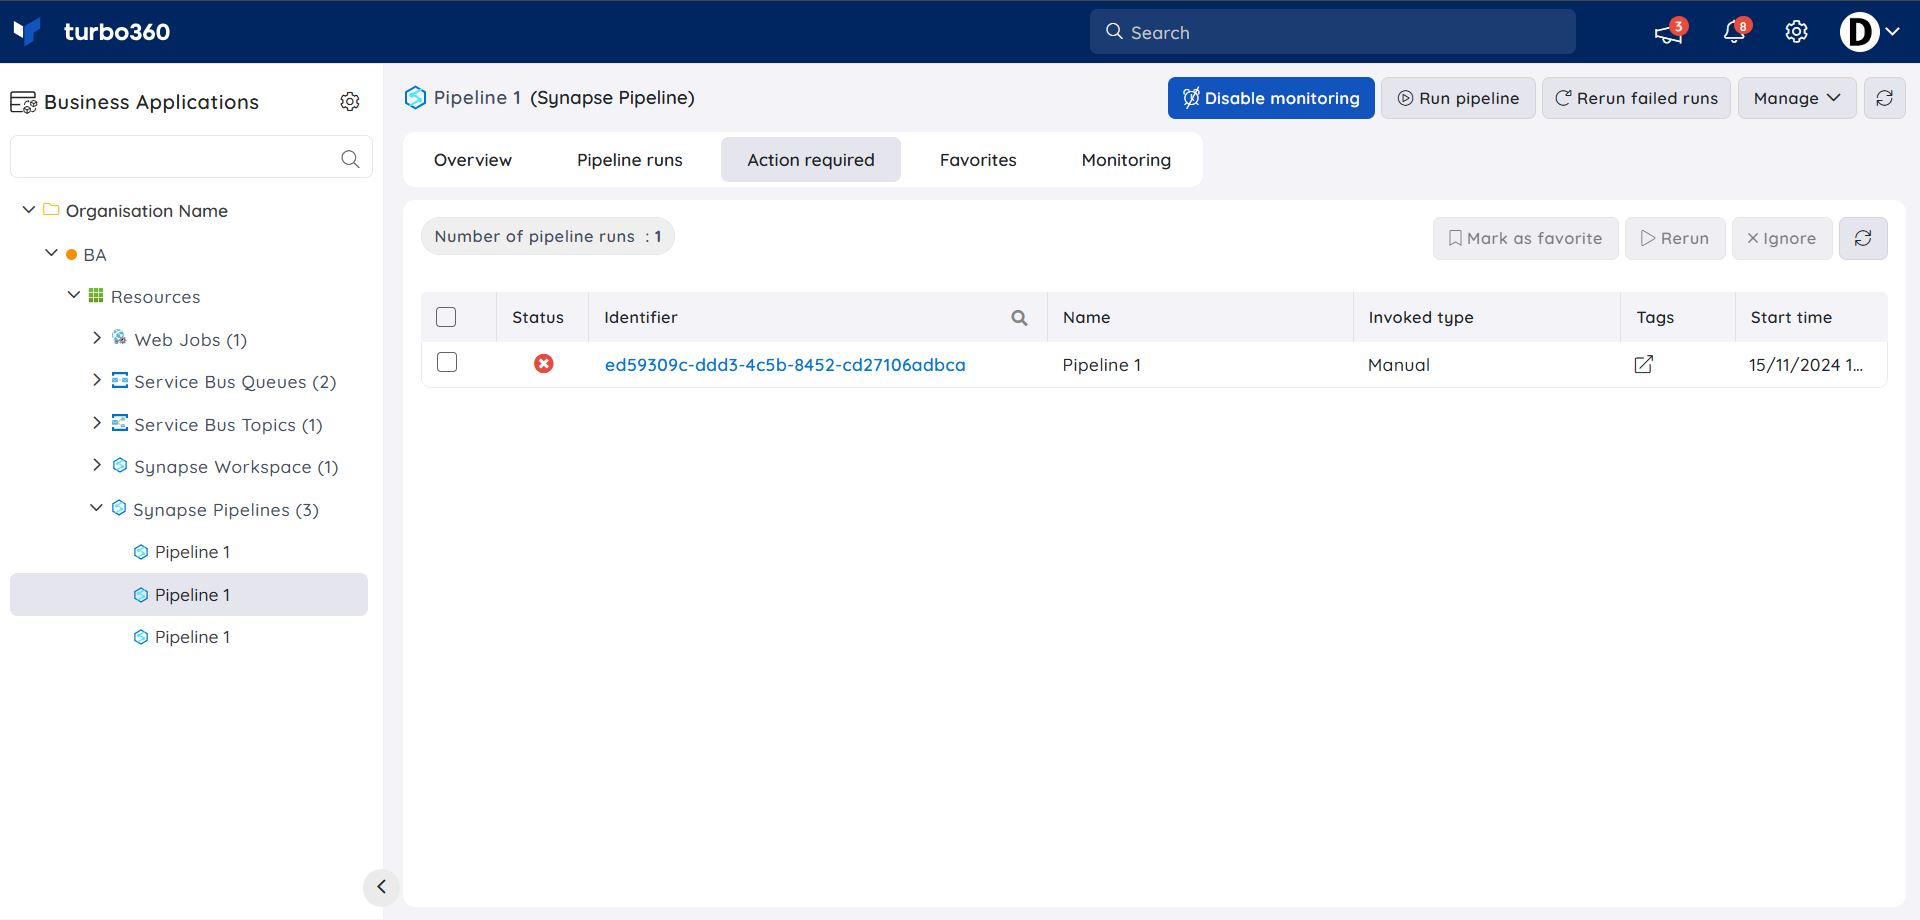
Favorites
- Mark as favorite — mark frequently used pipeline runs as favorites, with an optional description, from Pipeline runs or Action Required.
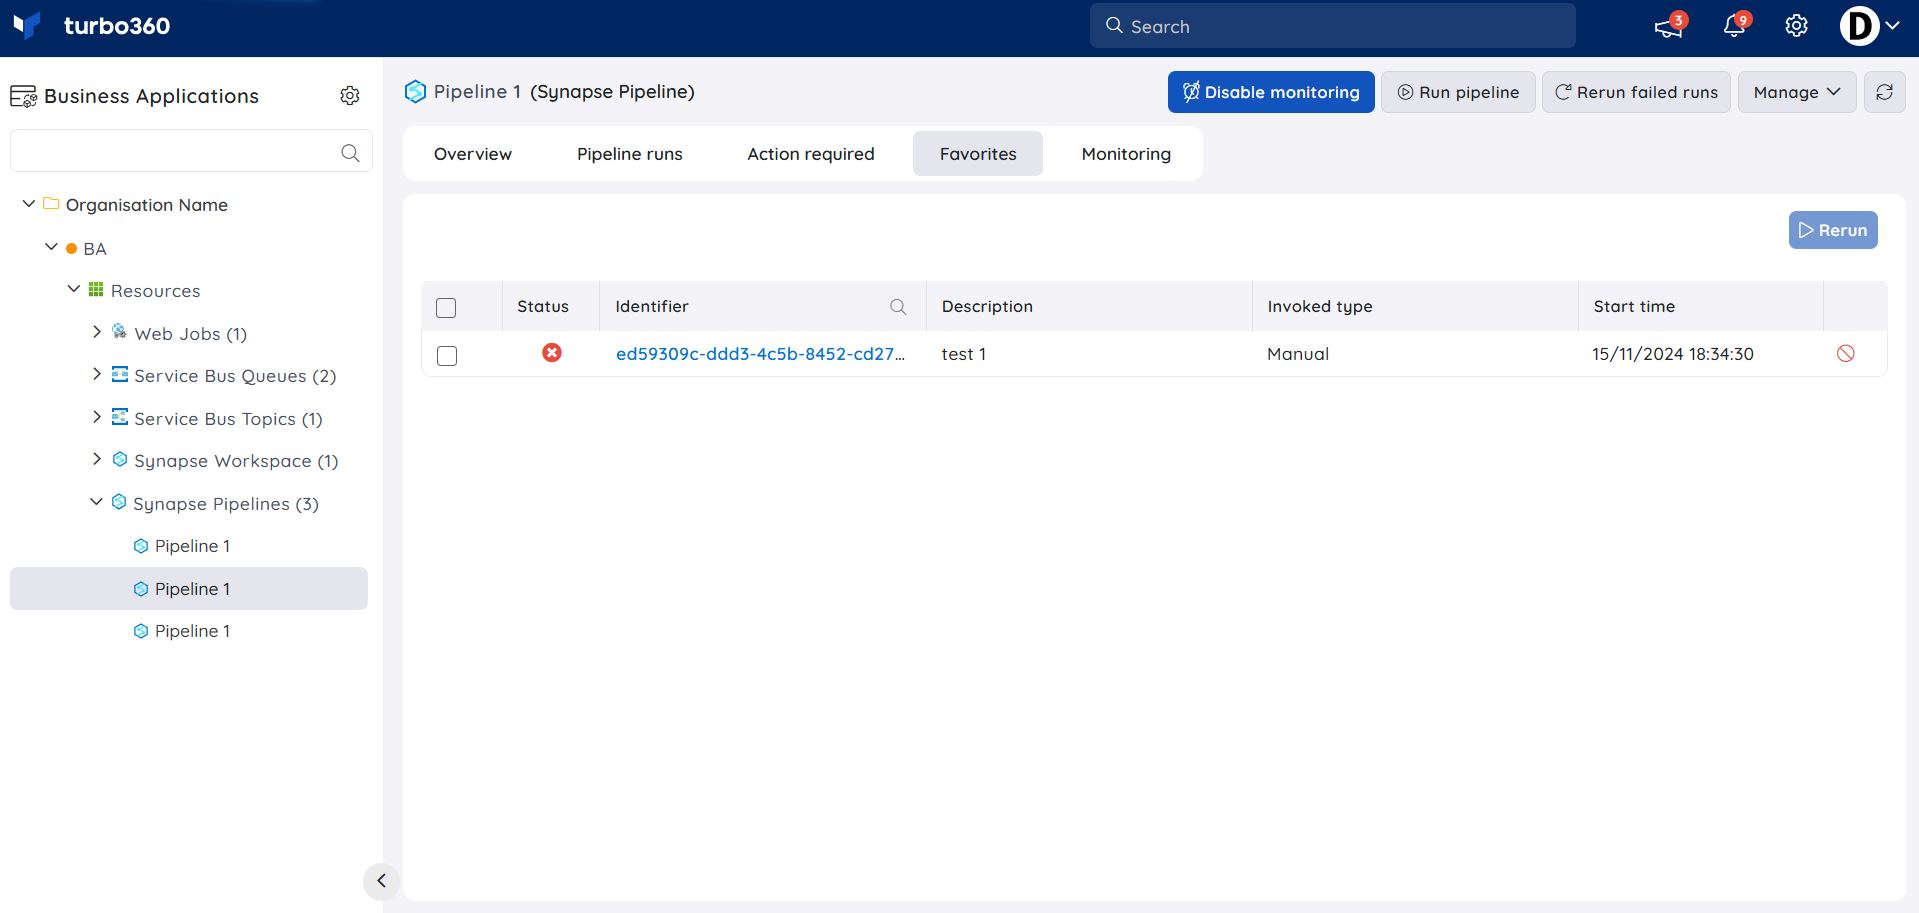
Inline task to rerun failed runs
- Inline task — quickly retry pipeline runs that failed within a specified timeframe (minimum 1 hour), directly from the resource.
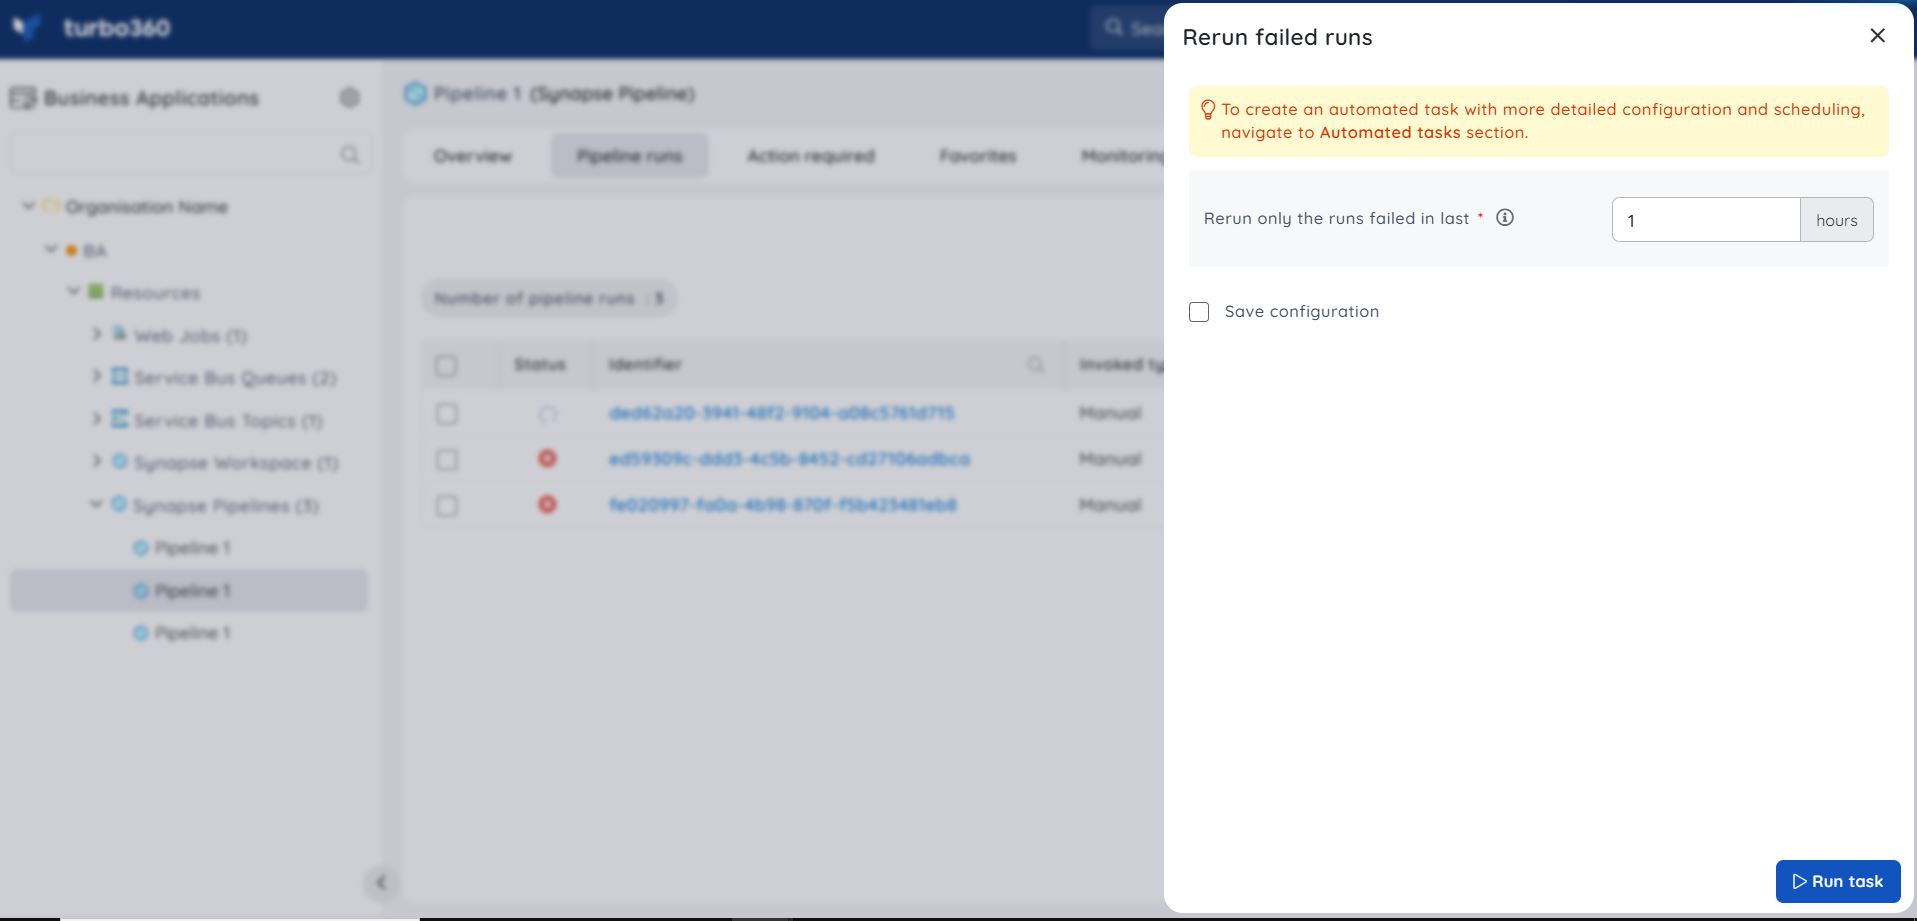
Task status can be viewed under Automated Tasks -> Task history.
- Use this feature to quickly create a task that runs immediately.
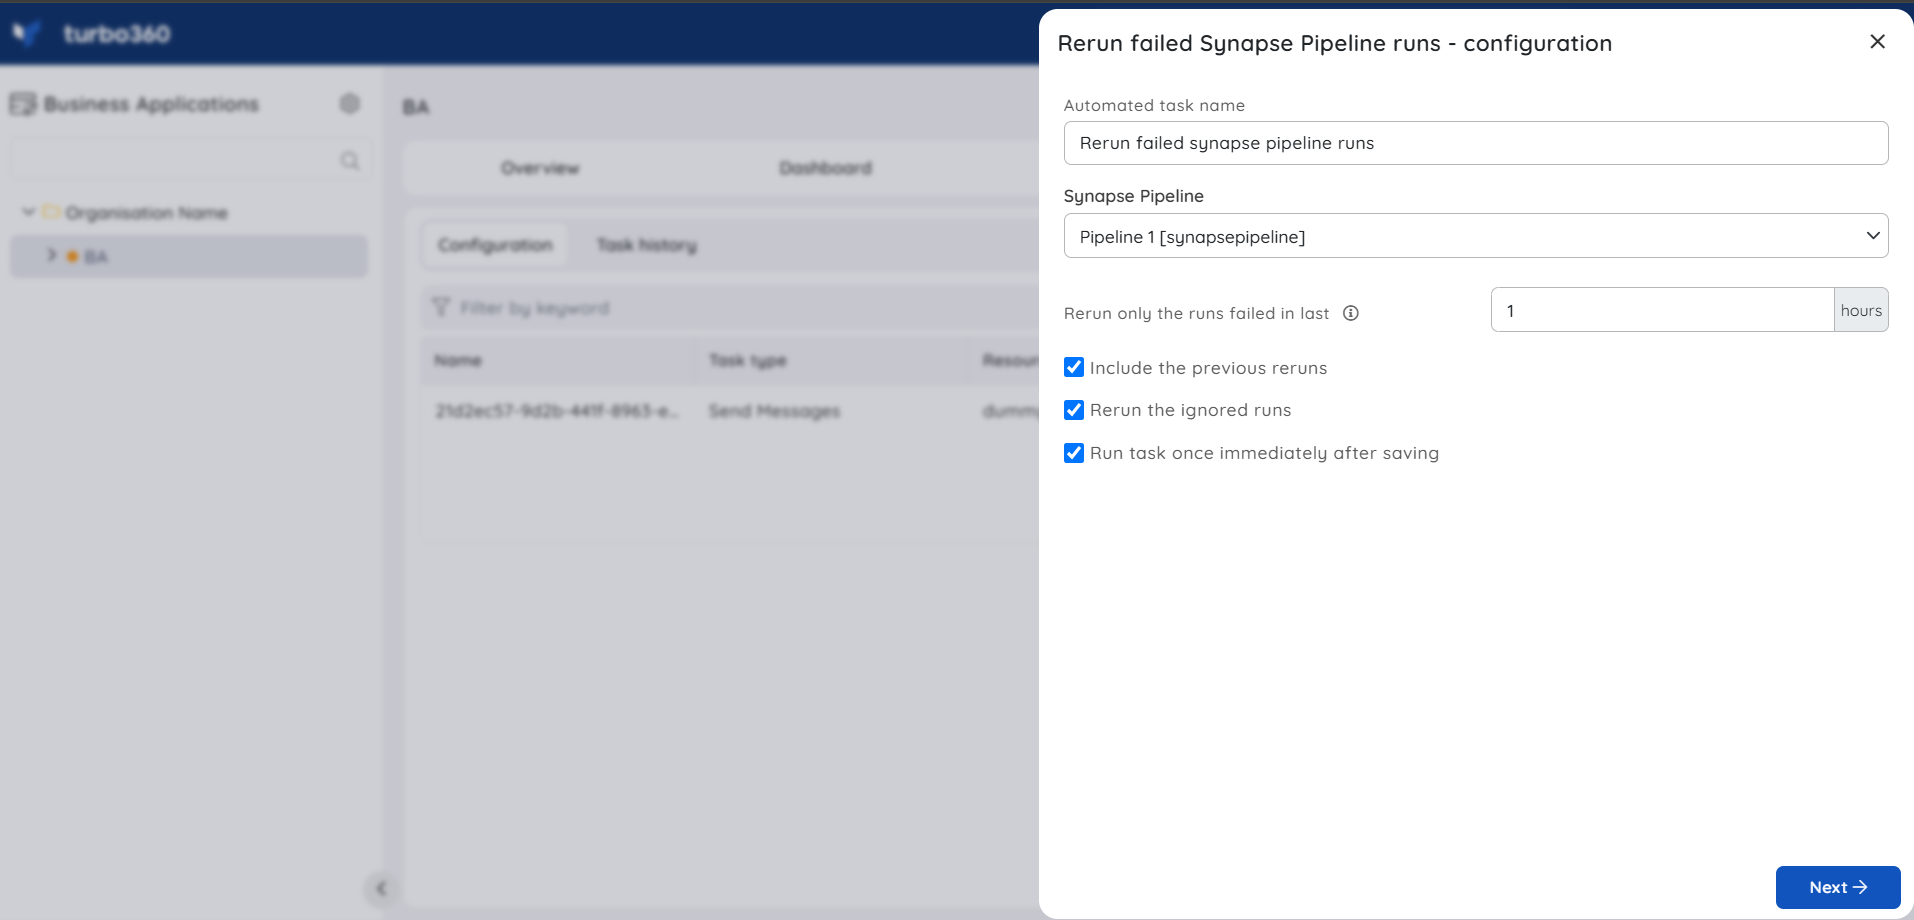
- Navigate to the Automated Tasks section in Turbo360 to create a task with more detailed configuration, scheduling, or recurring automation.
The Automated Task feature schedules failed pipeline runs to be rerun at a specific time, with options to include previous reruns and rerun ignored runs.
Resource dashboard
The dashboard surfaces activity run outcomes so you can assess pipeline health at a glance.
| Widget | What it shows |
|---|---|
| Cancelled Activity Runs | Count of activity runs that were cancelled. |
| Failed Activity Runs vs Succeeded Activity Runs | Compares failed activity runs against succeeded ones. |
| Succeeded Activity Runs | Count of activity runs that succeeded. |
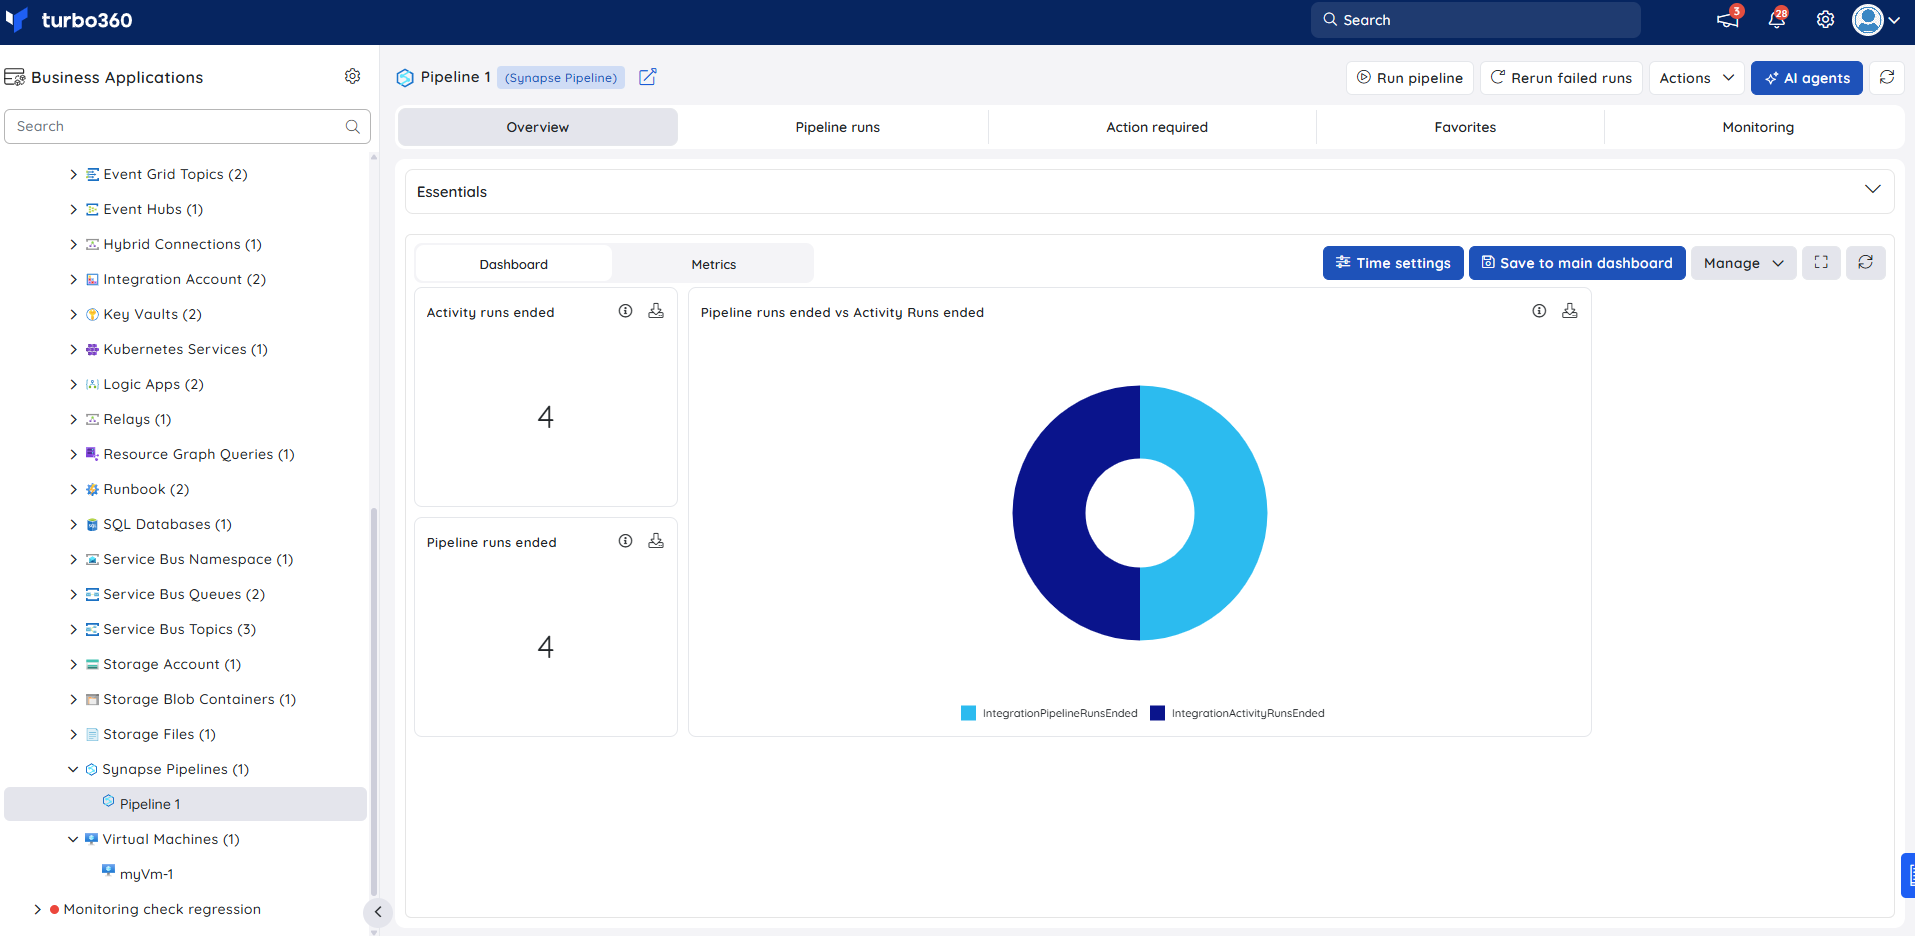
Widget values for the Synapse Pipeline resource are available only when time granularity is set to 1 minute or 1 hour.
Metrics
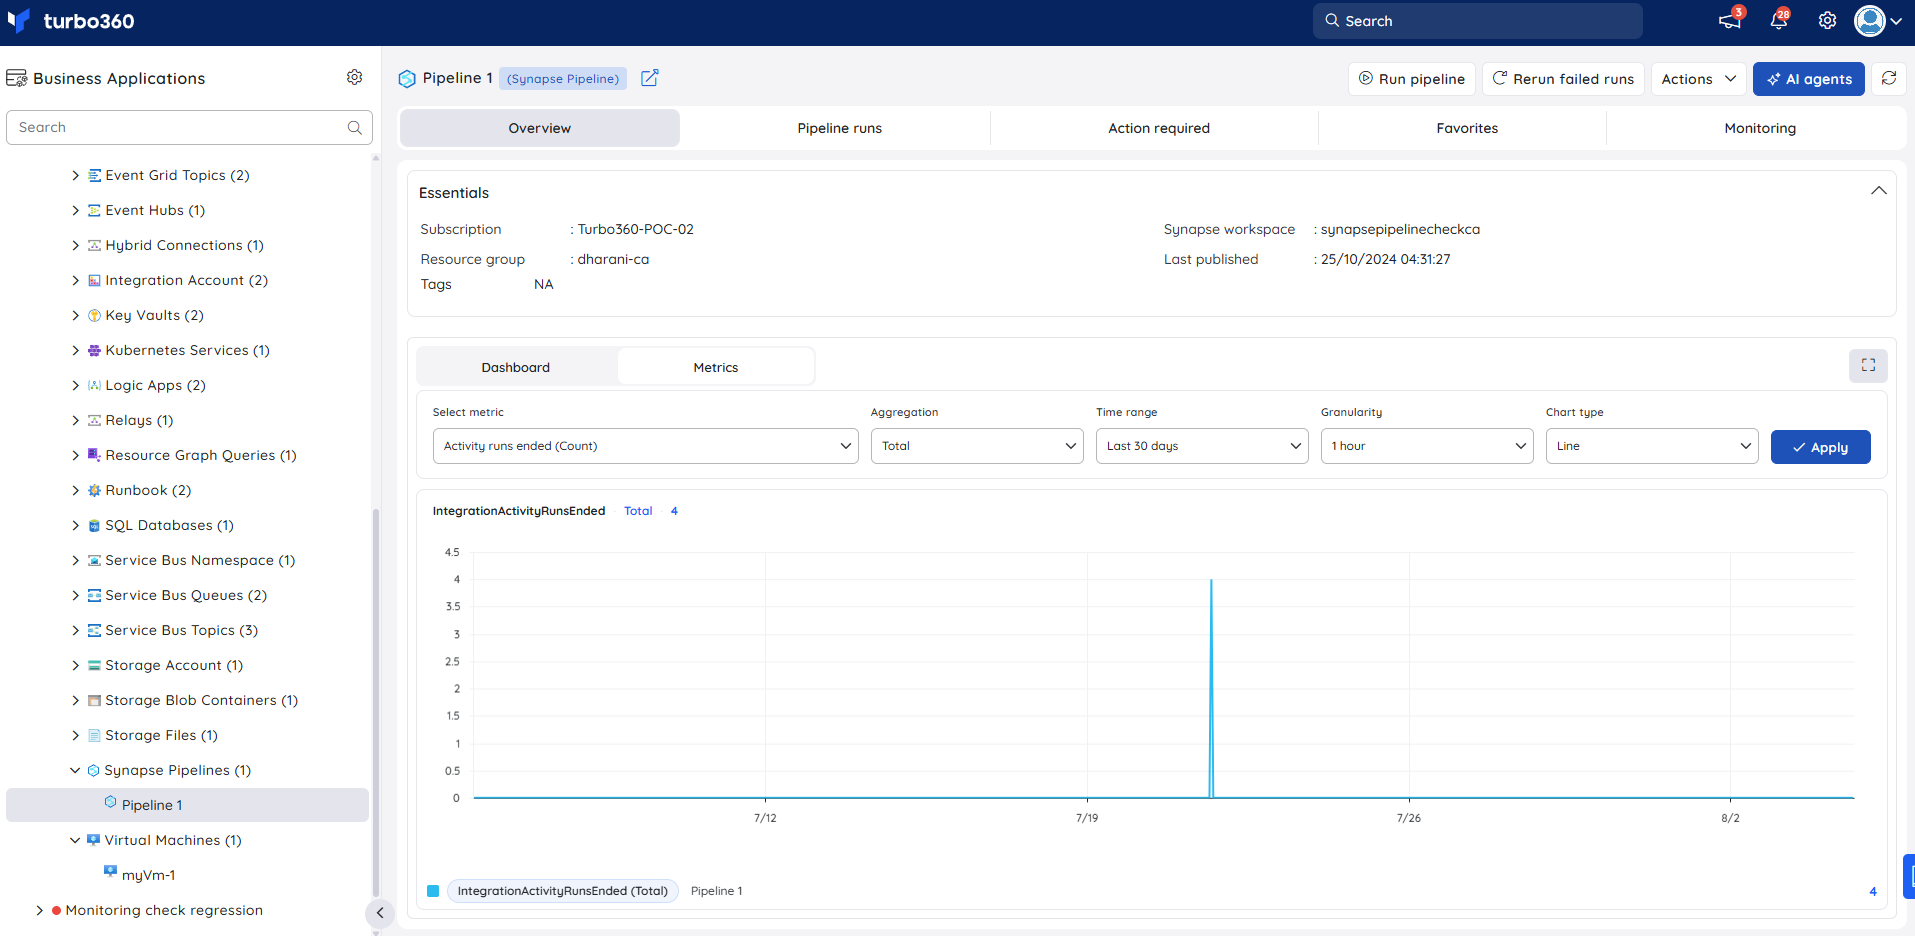
The Metrics tab surfaces activity run outcome data for Synapse Pipeline, giving you visibility into pipeline execution trends over time. Use the Metrics tab to identify periods with elevated failure rates or cancelled runs, and to confirm that pipeline health returns to normal after reruns or upstream data fixes.
You can add, remove, or reconfigure widgets to focus on the metrics most relevant to your support scenario.
Monitoring
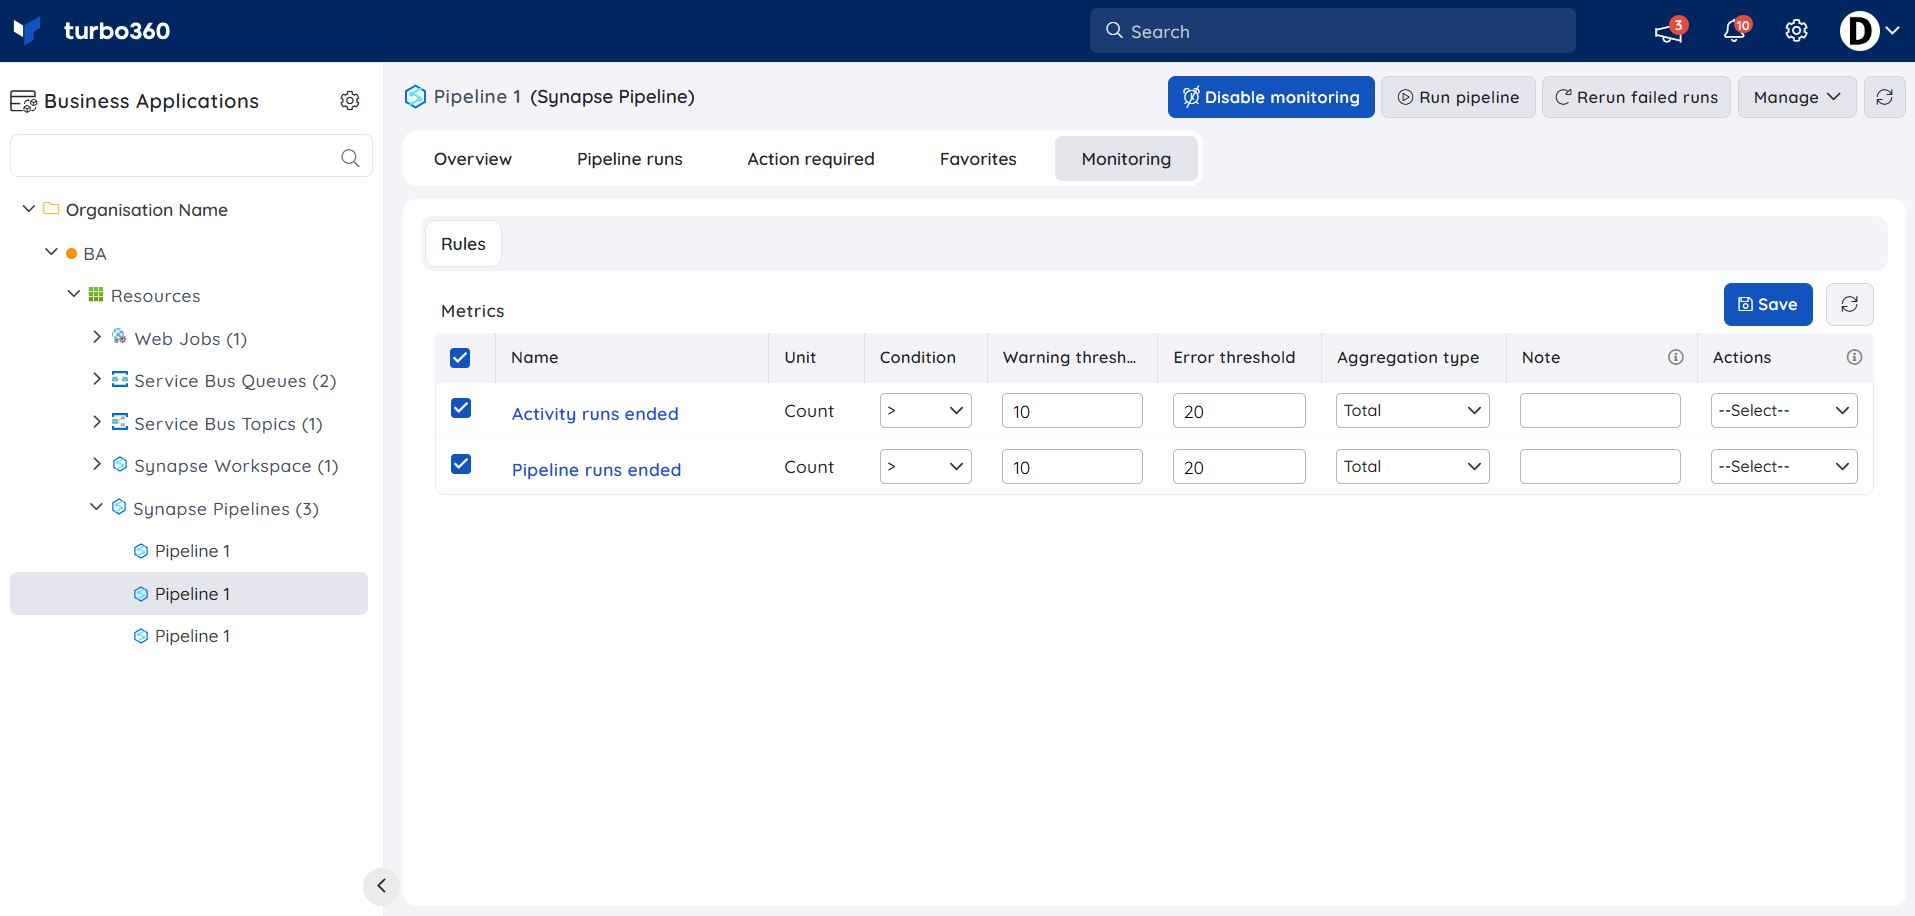
Synapse Pipeline supports monitoring rules configured under the resource's Monitoring section, with metric-type rules allowing selection of specific metrics.
Synapse Pipeline resources are monitored only when both the Rules evaluation frequency and Aggregation period are set to 1 minute or 1 hour, regardless of their combination. Synapse Pipelines do not have access to monitoring rules via the System profile.
Configuring monitoring rules
- Navigate to the Monitoring section of the resource.
- Specify the monitoring threshold values needed.
- For metric-type rules, select the metrics to monitor.
Troubleshooting
- Rerun option does not appear for a failed pipeline run
Cause: The role applied to the Business Application lacks the Reprocess permission.
Fix: Confirm the role has Reprocess access, then retry. - Dashboard widgets show no data
Cause: Time granularity is not set to 1 minute or 1 hour.
Fix: Adjust the time granularity setting to 1 minute or 1 hour. - Monitoring rule never evaluates
Cause: Rules evaluation frequency or Aggregation period is set to a value other than 1 minute or 1 hour.
Fix: Set both values to 1 minute or 1 hour. - Monitoring rules configured via System profile don't apply to a Synapse Pipeline
Cause: Synapse Pipelines do not support monitoring rules through the System profile.
Fix: Configure monitoring rules directly on the Synapse Pipeline resource instead.
Related articles
Was this article helpful?