

Understanding the savings on a schedule
- 05 Aug 2026
- 5 Minutes to read
- Print
- DarkLight
- Download PDF
Understanding the savings on a schedule
- Updated on 05 Aug 2026
- 5 Minutes to read
- Print
- DarkLight
- Download PDF
Article summary
Did you find this summary helpful?
Thank you for your feedback!
In this page we will walk through an example of a schedule which is configured and understand how the savings are calculated and realized.
Top Level Schedule
Below is a definition of the meaning of the key columns in the schedule level settings.

Column | Description | More Info |
|---|---|---|
List Cost | This is the sum of the list price for resources within the schedule |
|
Potential Savings | This is the sum of the potential savings at resource level | |
Amortized Cost | This is the sum of the amortized cost for the resources in the schedule |
|
Schedule Time Settings
The times I have configured my schedule for are shown below.
.png)
This equates to 50 hours in up time and 118 hours in downtime.
If the schedule is up for 50 hours and down for 118 hours then this means that for >70% of the time the resources will be in the down state and we will hope to see in the region of 70% savings compared to if the resources were in the up state for 100% of the time.
Schedule Resources
Below you can see I have 3 resources on this schedule.
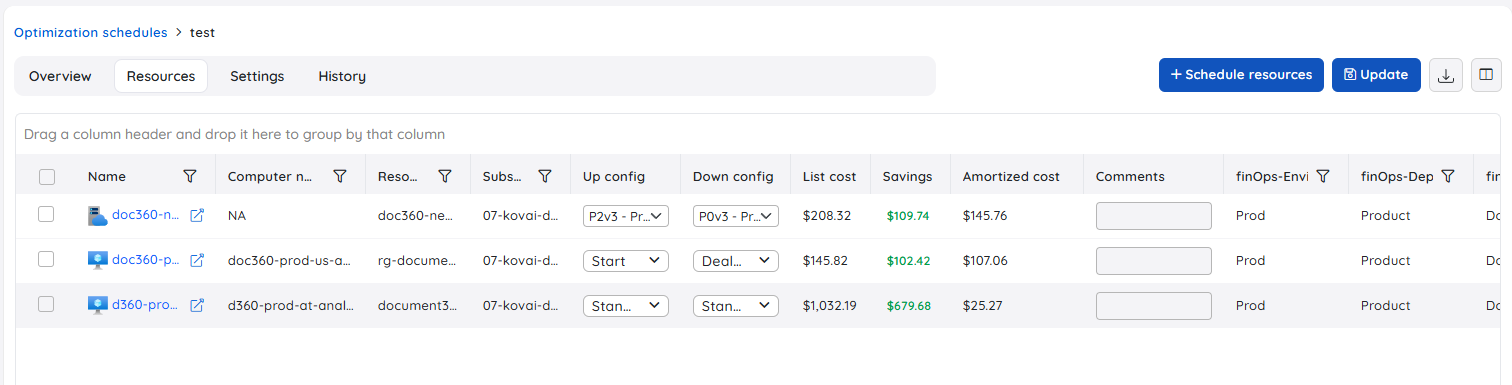
Compare to Top Level image above:
List Cost = The list cost shown at scheduler level in the image earlier in the document is the sum of list cost for the resource in the list above. An explanation of list cost is below.
Savings = The savings shown at scheduler level in the image earlier in the document is a sum of the savings shown above.
Amortized Cost = The schedule level (image earlier in the document) amortized cost is the sum amortized cost shown in the image above. An explanation of Amortized cost is below.
The resource configuration above tells me:
Row in Schedule | Schedule Action | Up Configuration | Down Configuration |
|---|---|---|---|
1 - App Service Plan | Downsize out of hours | Scale up to P2V3 Premium | Scale down to P0V3 Premium |
2 - VM | Turn off out of hours | On (Standard D4as V4 SKU) | Off |
3 - VM | Downsize out of hours | Scale up to —> (Standard D32as V4) | Scale up down to —> (Standard D2as V4) |
The cost related columns in the resource view of the scheduler tell me the below info:
Column | Source | Description | More Info |
|---|---|---|---|
List Cost | Azure list price for the sku | This is the Azure list price for the resource if it was in the up configuration for the entire 30 day period. | We use a 30 day period here so there is no confusion between months with different number of days. |
Savings | Estimated based on configuration in the schedule | This is the expected savings compared to the list price based on the number of up and down hours configured on the schedule. It is based on a 30 day comparison. | As an example, if the list price for the resource was $100 and you turn it off for 50% of the time we would expect the savings to be $50 |
Amortized Cost | Based on previous cost data we have collected | This is the amortized cost that you have paid for this resource for the last 30 days | The typical example should be, with a virtual machine on a pay as you go pricing with no savings plans or RI,s and if the schedule was to turn the VM off for 50% of the time then the VM which costs $100 should have an amortized cost of $50. There are other factors that can come info plan in some circumstances such as the below.
|
Points to Note
In my example above you may notice that the VM (3rd row) I will be downsizing has a smaller than you might expect amortized cost. This is because in reality this resource has been set as a Standard D2as v4 VM SKU for the last month. In the schedule I will be moving it to a bigger size than normal during working hours so users have more power available but in the evening I will be shrinking it back to the smallest size.
In this sample schedule there are also reservations which apply to these resources quite often which can also affect the amortized cost which is why the amortized cost can look lower than the list cost before you start using the scheduler. In these Azure will attempt to reallocate your reservation to other azure resources provided there are resources which would be within the scope of the reservation. You need to be careful though if you are using a resource on a schedule that you intend to be picked up by a reservation, these are often competing optimization approaches and you need to check you dont end up with under utilized reservations.
Calculation
Resource Level Savings
Resource | If un scheduled | Scheduled Up | Scheduled Down | Savings |
|---|---|---|---|---|
1 = App Service |
|
|
|
|
2 = VM to stop / start |
|
|
|
|
3 = VM to scale up/down |
|
|
|
|
Schedule Level Savings
Going back to the earlier top level image of the scheduler savings. This is calculated by totaling the resource level savings.
In this case Total Savings = $545.22
Was this article helpful?