

Virtual Machine
- 05 Aug 2026
- 4 Minutes to read
- Print
- DarkLight
- Download PDF
Virtual Machine
- Updated on 05 Aug 2026
- 4 Minutes to read
- Print
- DarkLight
- Download PDF
Article summary
Did you find this summary helpful?
Thank you for your feedback!
Overview
A Virtual Machine (VM) is a virtual computer with dedicated RAM, CPU, and storage borrowed from a physical host — a computer file, typically an image, that runs any operating system (Linux distribution or Windows Server) in its own window as a separate computing environment. Security types available at creation time protect the environment from vulnerabilities.
Business value
Managing Virtual Machine status from Turbo360, reflected directly in the Azure portal, lets you respond to start/stop/restart needs across multiple VMs without switching tools.
How it works
- Deploying a Virtual Machine also creates several interlinked resources: Resource Group, Storage Account, Virtual Network, Public IP Address, Network Interface, and Data Disks.
- Any operation performed on a VM through Turbo360 is reflected in the Azure portal.
Permissions
Access to Virtual Machine actions is controlled through RBAC when adding a role to a Business Application.
| Permission | Description |
|---|---|
| Read | View dashboard and monitoring configuration. |
| Manage | Start, Stop, and Restart the VM, and configure monitoring rules. |
Operations
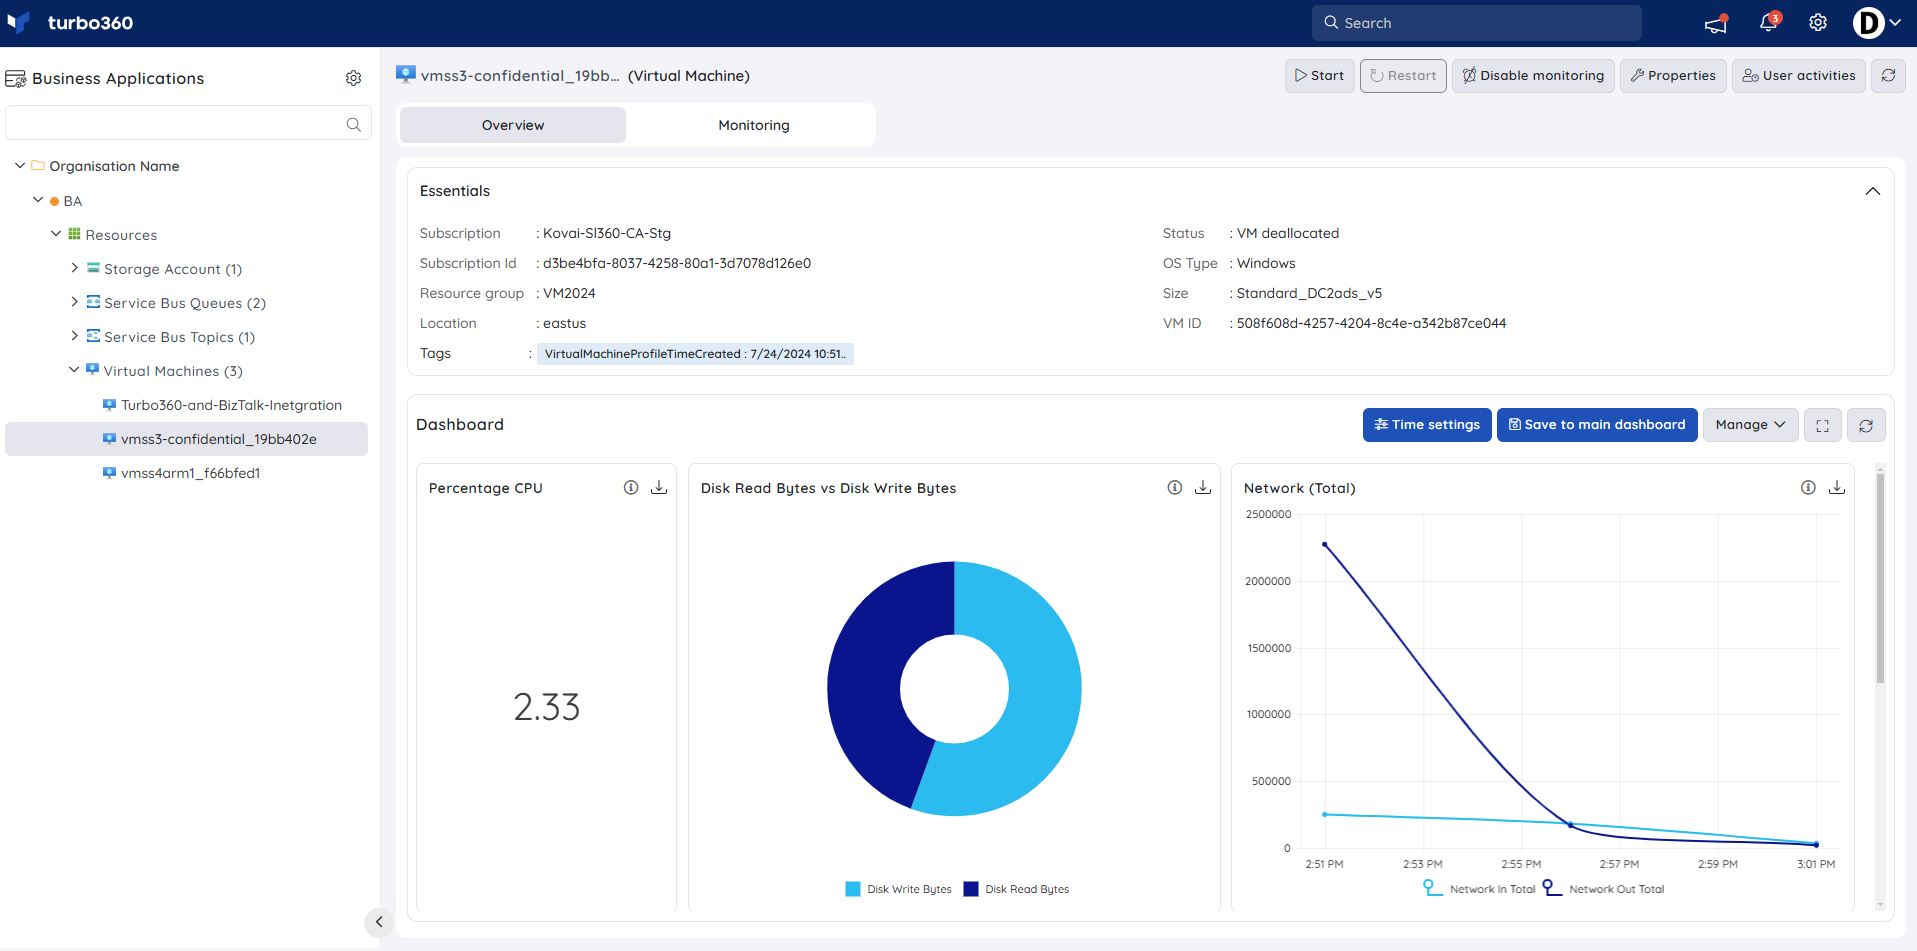
Turbo360 lets you control Virtual Machine status directly, without switching to the Azure portal.
Start, Stop, and Restart
- Start — bring a stopped VM online.
- Stop — shut down a running VM.
- Restart — stop and start the VM in sequence.
Bulk operations
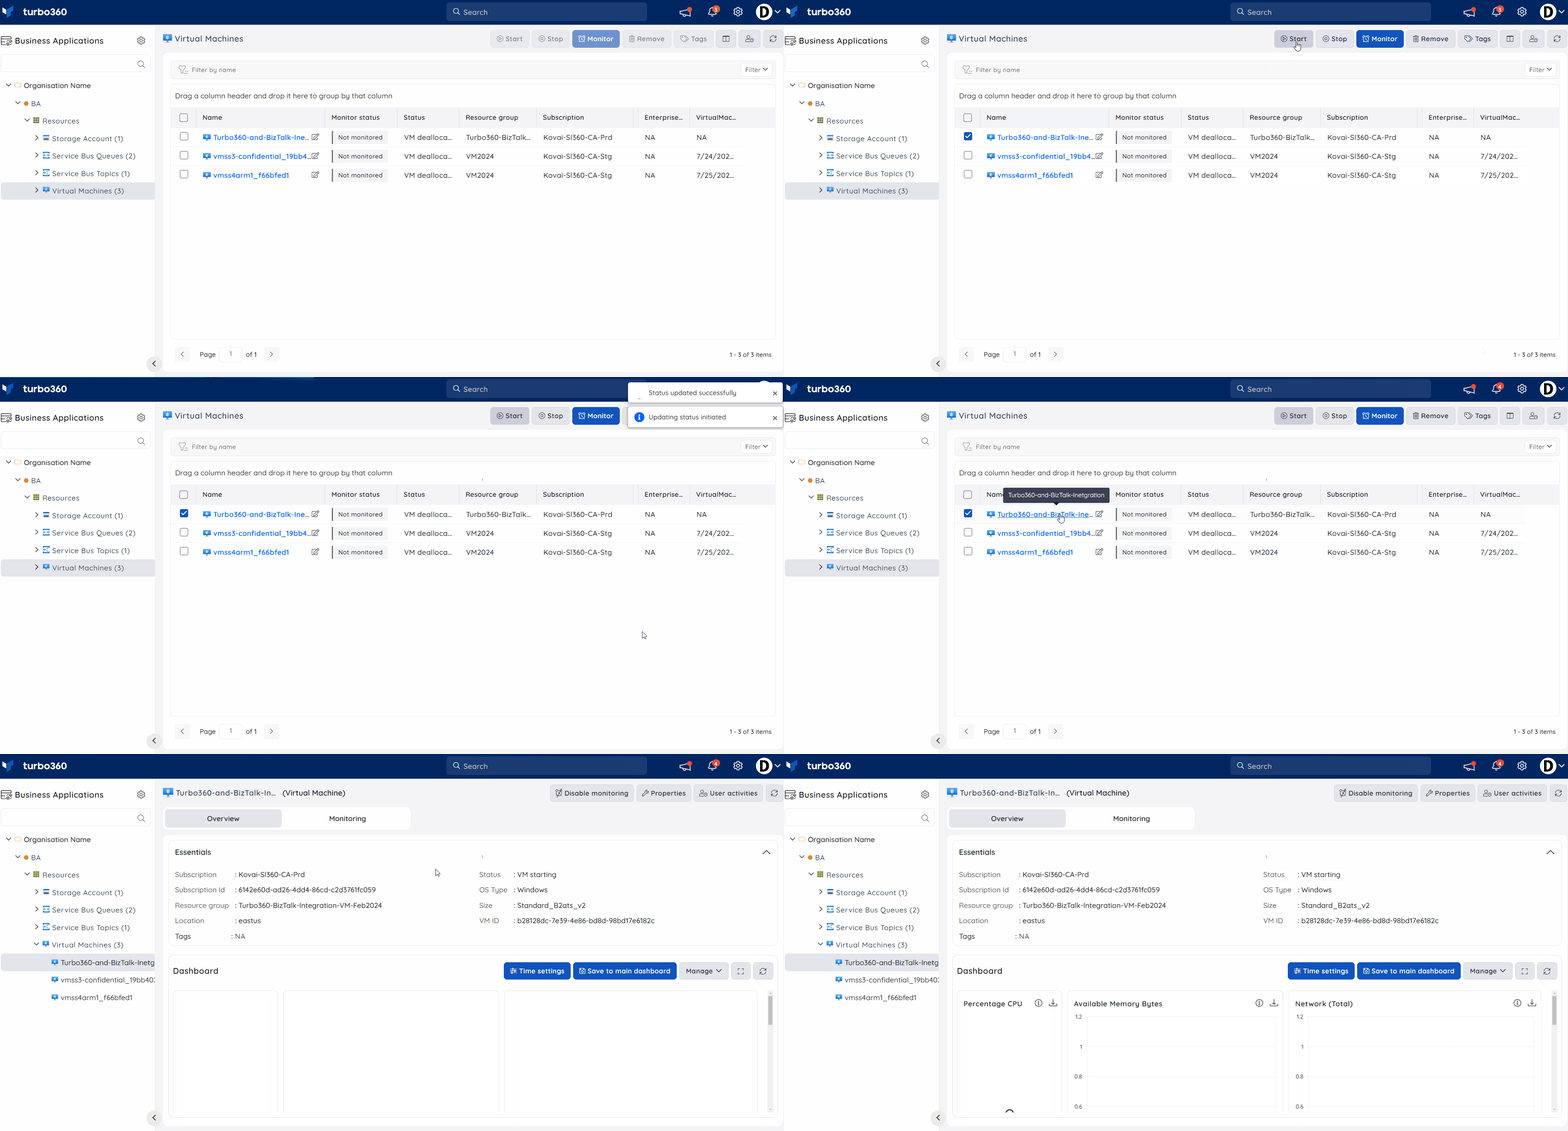
- Bulk Start/Stop/Restart — perform the same operation on multiple selected VMs from the Virtual Machines resource section. Use this when several VMs need the same status change together, such as during planned maintenance.
Resource dashboard
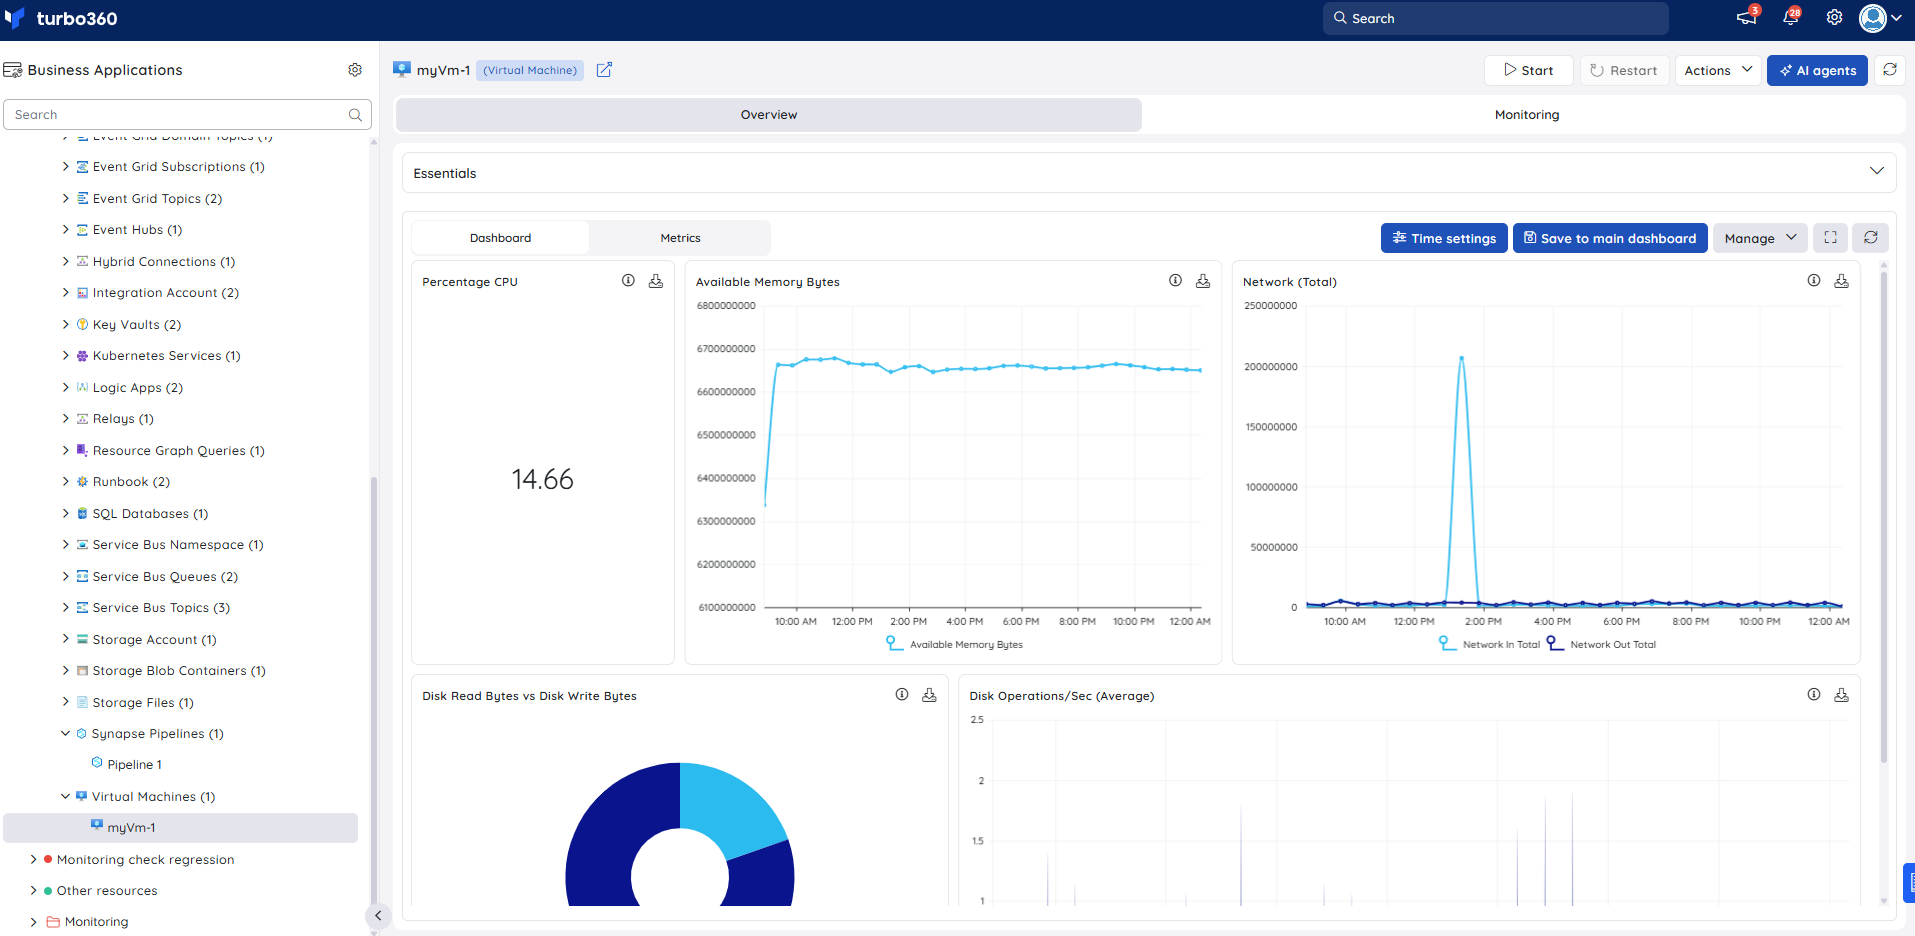
The dashboard surfaces CPU, memory, network, and disk signals so you can assess VM performance at a glance.
| Widget | What it shows |
|---|---|
| Percentage CPU | Current CPU utilization of the VM. |
| Available Memory Bytes | Memory currently available on the VM. |
| Network (Total) | Total network throughput for the VM. |
| Disk Read Bytes vs Disk Write Bytes | Compares disk read volume against write volume. |
| Disk Operations/Sec (Average) | Average rate of disk operations per second. |
Metrics
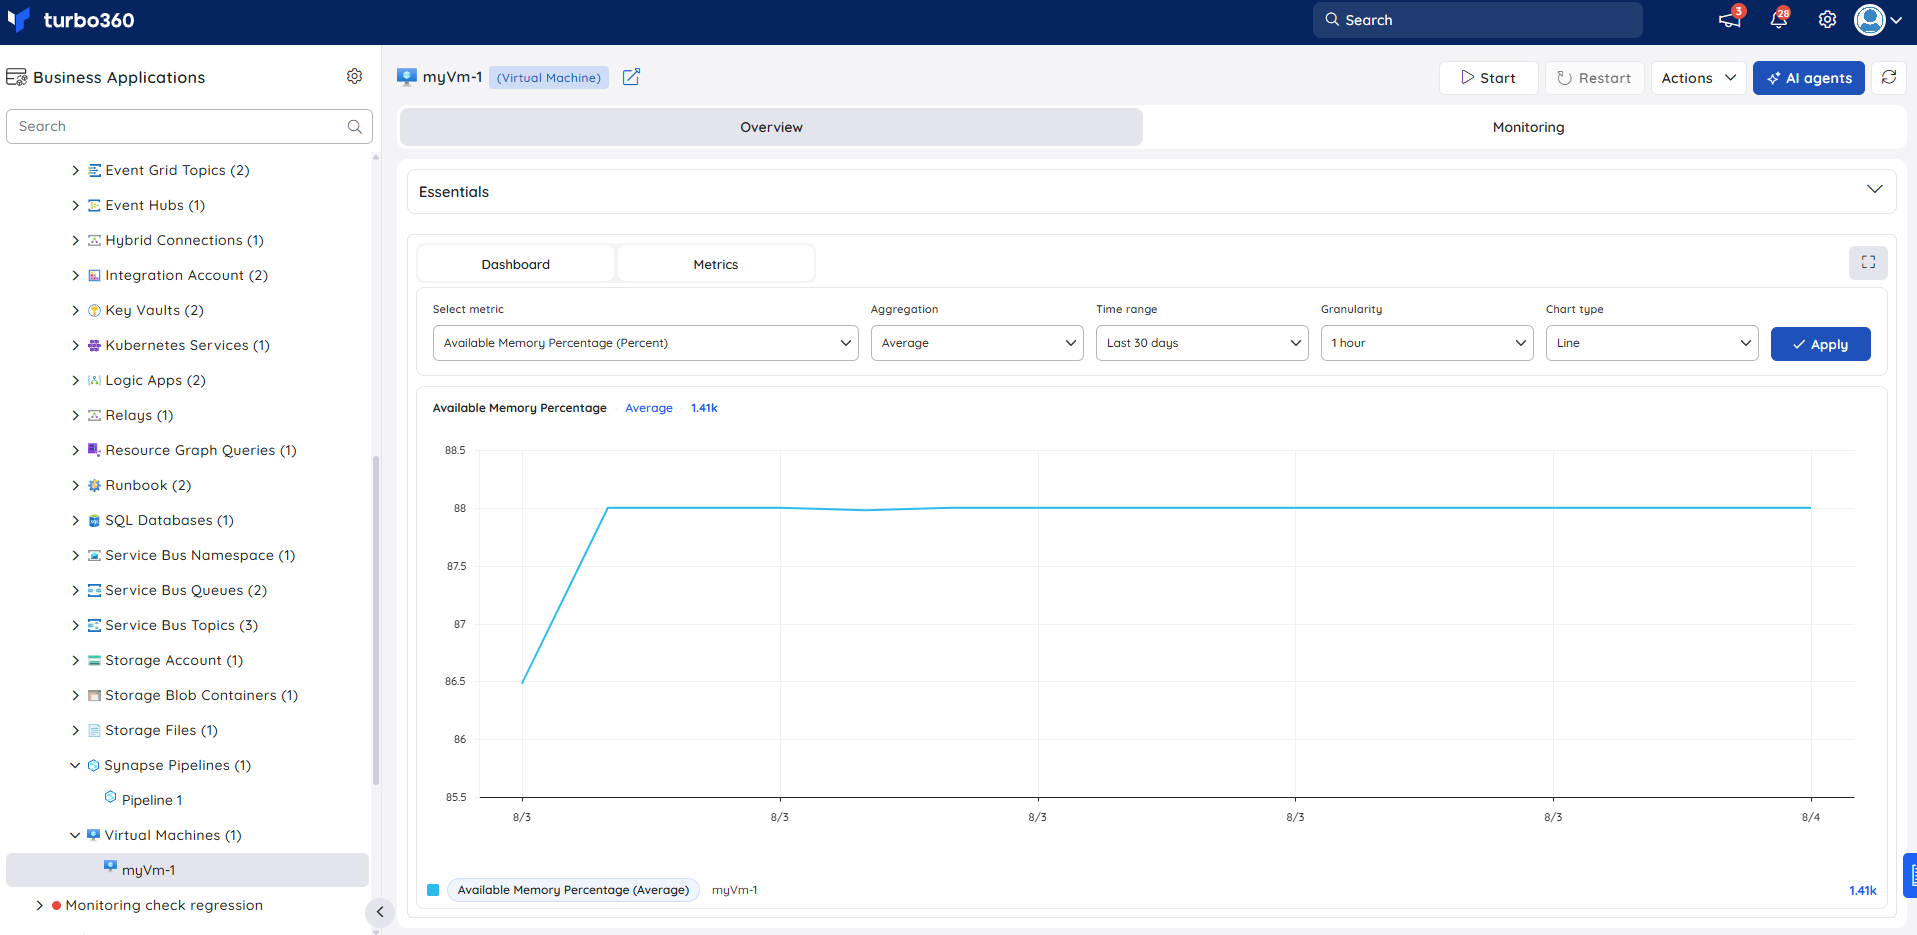
The Metrics tab surfaces CPU, memory, network, and disk data for Virtual Machine, giving you visibility into VM performance trends over time. Use the Metrics tab to correlate resource pressure with application errors, and to confirm that performance returns to expected baselines after scaling, restart, or configuration changes.
You can add, remove, or reconfigure widgets to focus on the metrics most relevant to your support scenario.
Monitoring
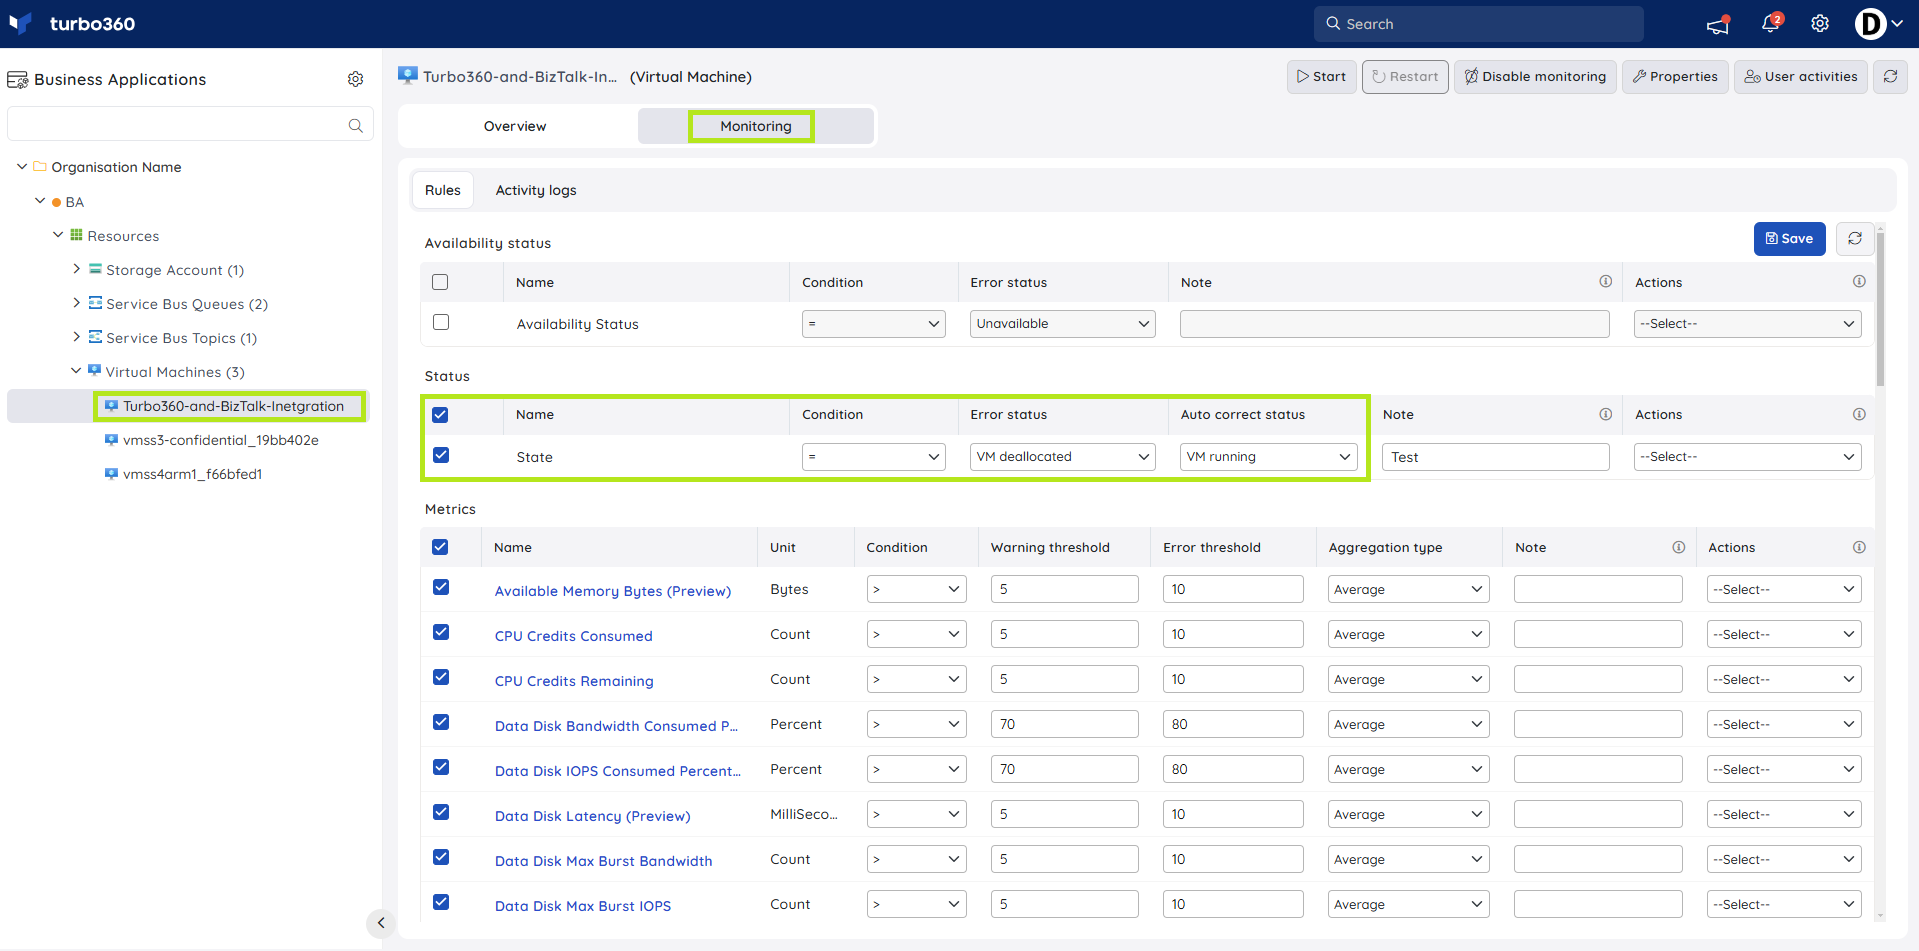
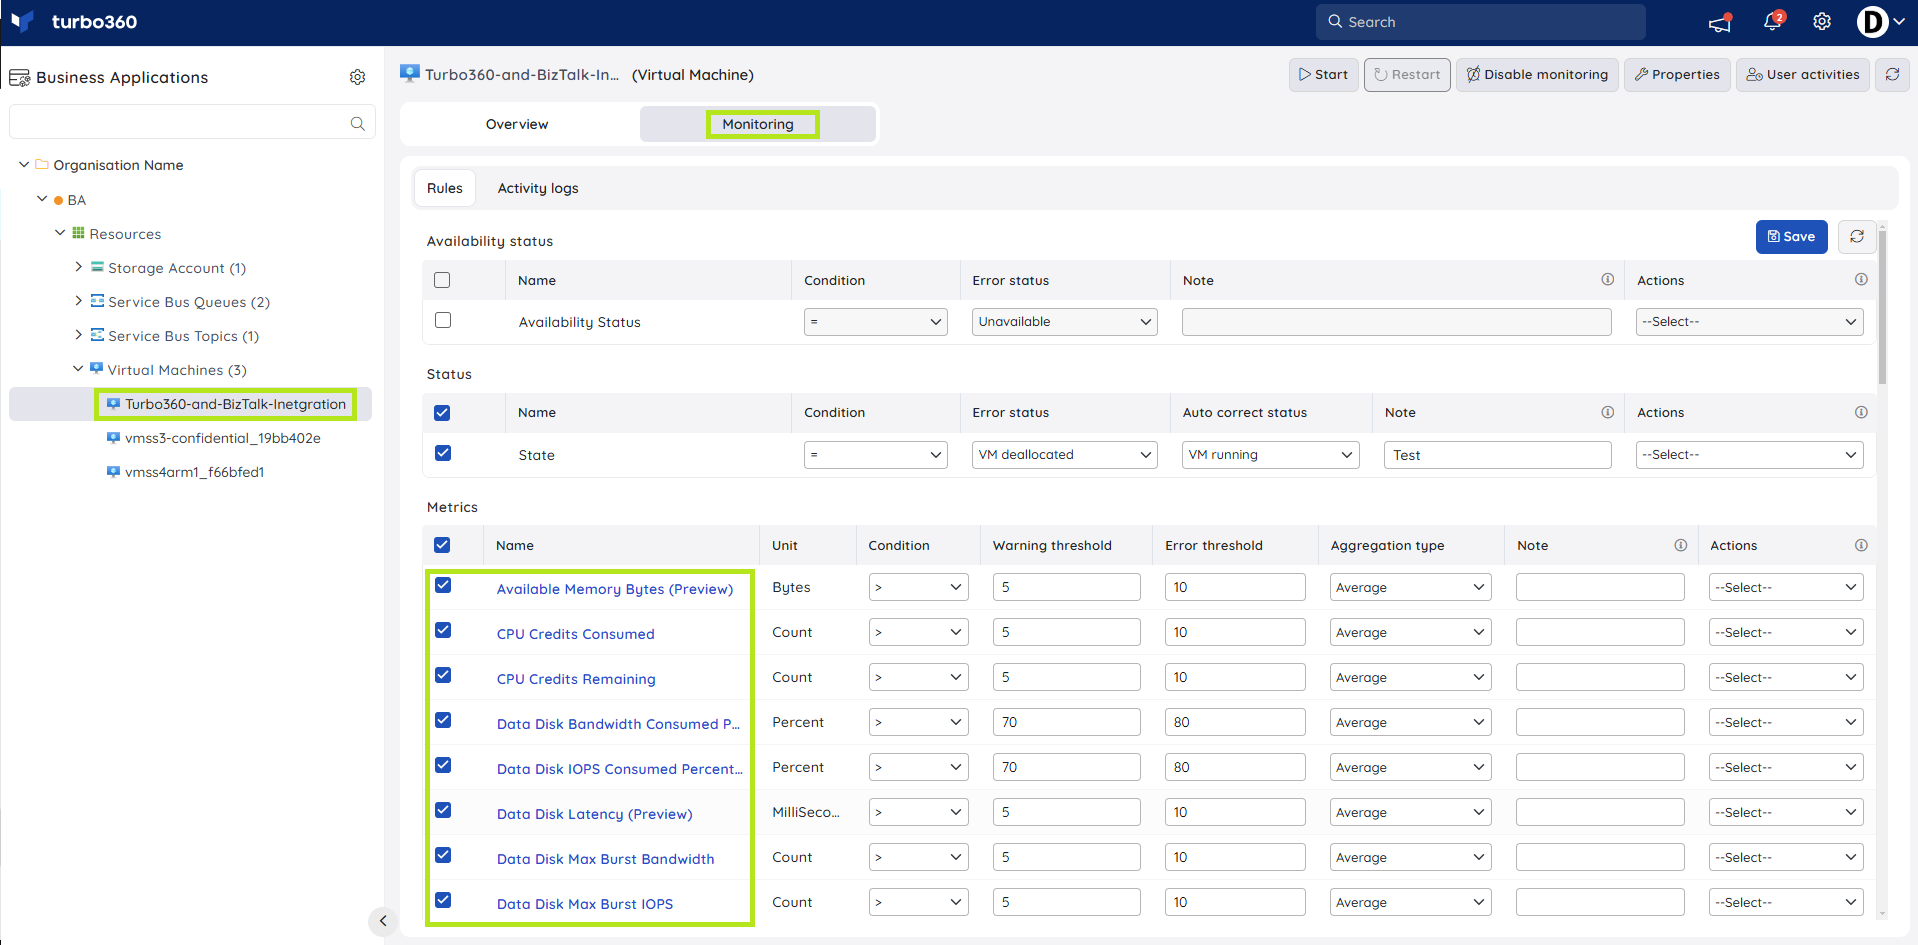
Virtual Machine supports state and metric monitoring rules, configured under the resource's Monitoring section. Threshold values can be specified based on your needs, and when the rule type is a metric, selecting specific metrics against metric rules is also an option.
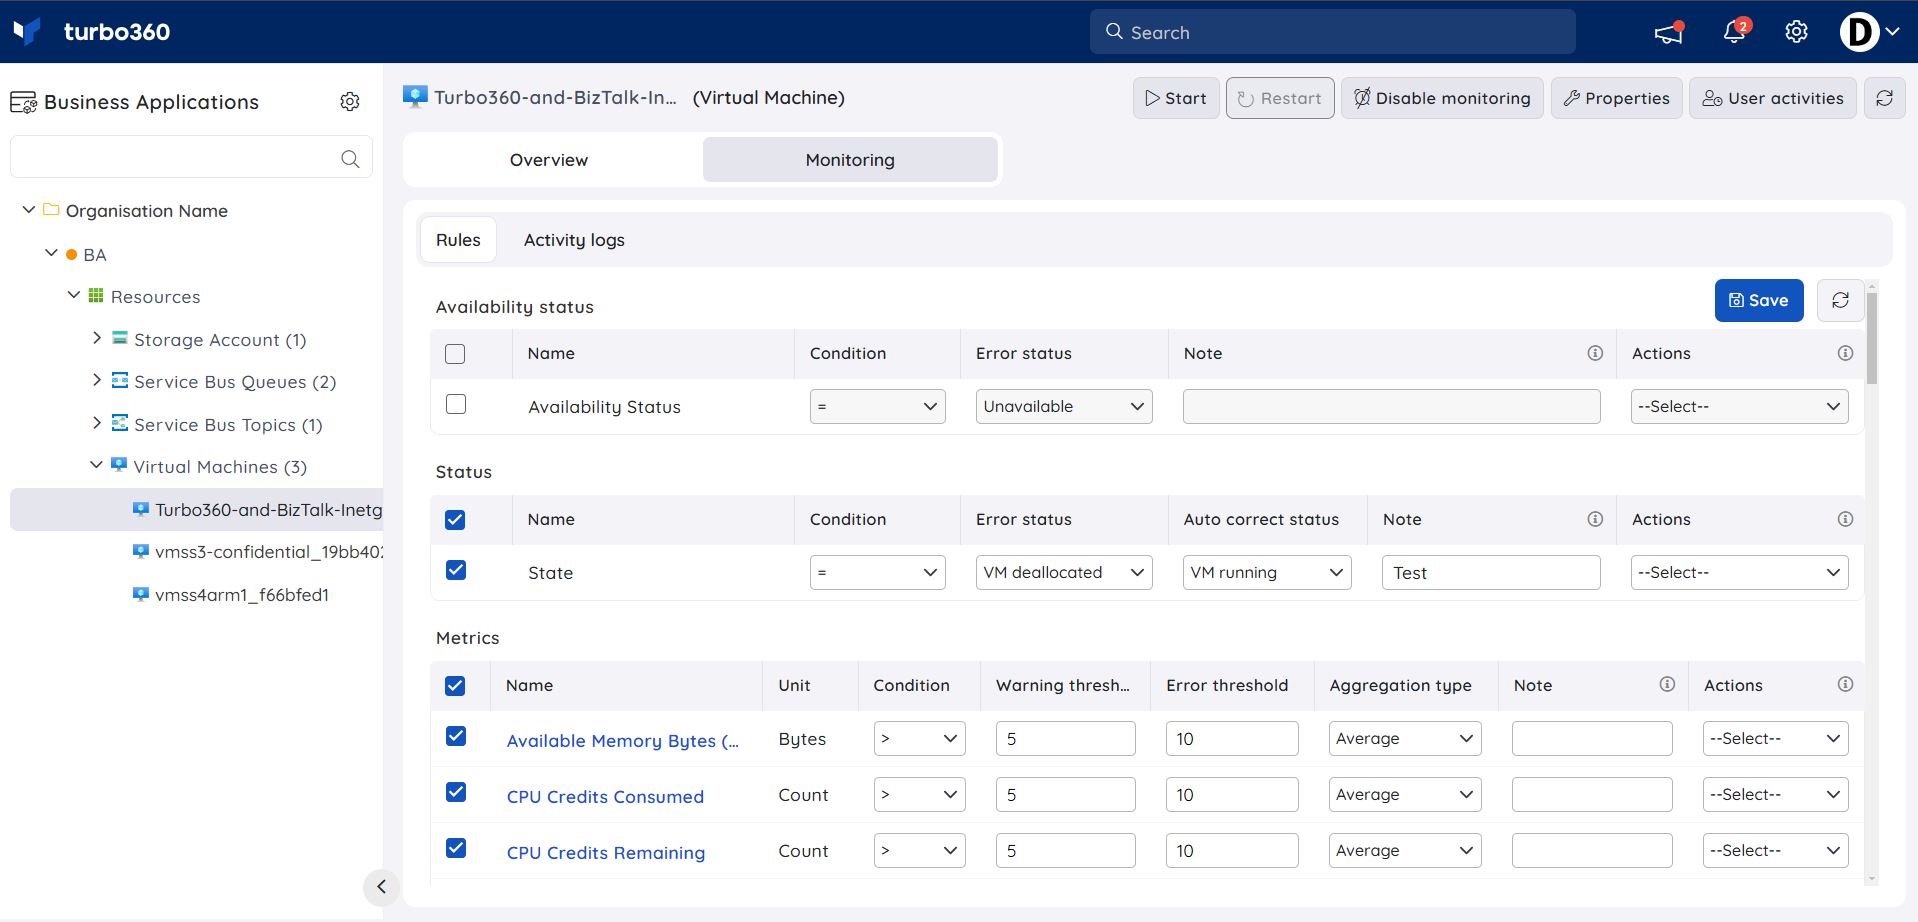
State monitoring
Tracks whether the VM is in the running state. Use this when you need to be alerted if the VM is in any state other than running; an auto-correct option can have Turbo360 turn the VM back on automatically.
Metric monitoring
Tracks VM performance counters against configured thresholds.
Monitoring recommendations
In this section we discuss some common monitoring recommendations and scenarios.
State — to monitor that the state of your VM is in a running state, turn on state monitoring and raise an alert if the VM is in any state other than running. There are even options to auto-correct an error scenario and have Turbo360 turn the VM back on.
Metrics — with Azure VM there are a number of counters available to monitor:
| Metric | Warning | Error |
|---|---|---|
| Percentage CPU | > 90 | > 95 |
| Available Memory Bytes (Preview) | Varies | Varies |
| Data Disk Bandwidth Consumed Percentage | > 90 | > 95 |
| Data Disk IOPS Consumed Percentage | > 90 | > 95 |
| OS Disk Bandwidth Consumed Percentage | > 90 | > 95 |
| OS Disk IOPS Consumed Percentage | > 90 | > 95 |
Note some of the disk metrics require premium storage. Details of each counter are on the page below.
Microsoft VM monitoring reference — metrics
Log queries — if you want to monitor internal guest performance characteristics from your VM, you are likely to be using the Azure Monitor Agent, which streams log data to Azure Monitor. From there, you can use Kusto queries to monitor the status of metrics on the guest VM.
Microsoft VM monitoring reference — Azure Monitor Logs tables
More info
Microsoft VM monitoring reference
Troubleshooting
- Start, Stop, or Restart operation fails
Cause: The VM is in a transitional state, or the role lacks the Manage permission.
Fix: Wait for the current state transition to complete, or confirm the role has Manage access, then retry. - State monitoring rule does not auto-correct
Cause: No auto-correct status was configured on the rule.
Fix: Edit the rule and specify an auto-correct status. - Disk metric shows no data
Cause: The disk metric requires premium storage, which isn't in use on this VM.
Fix: Confirm the storage tier, or monitor a metric available on standard storage instead. - Dashboard widgets show no data after associating the VM
Cause: The resource has not completed its first monitoring cycle since being added to the Business Application.
Fix: Wait for the next monitoring cycle, then refresh the dashboard.
Related articles
Was this article helpful?