

What is service map?
- 05 Aug 2026
- 2 Minutes to read
- Print
- DarkLight
- Download PDF
What is service map?
- Updated on 05 Aug 2026
- 2 Minutes to read
- Print
- DarkLight
- Download PDF
Article summary
Did you find this summary helpful?
Thank you for your feedback!
Overview
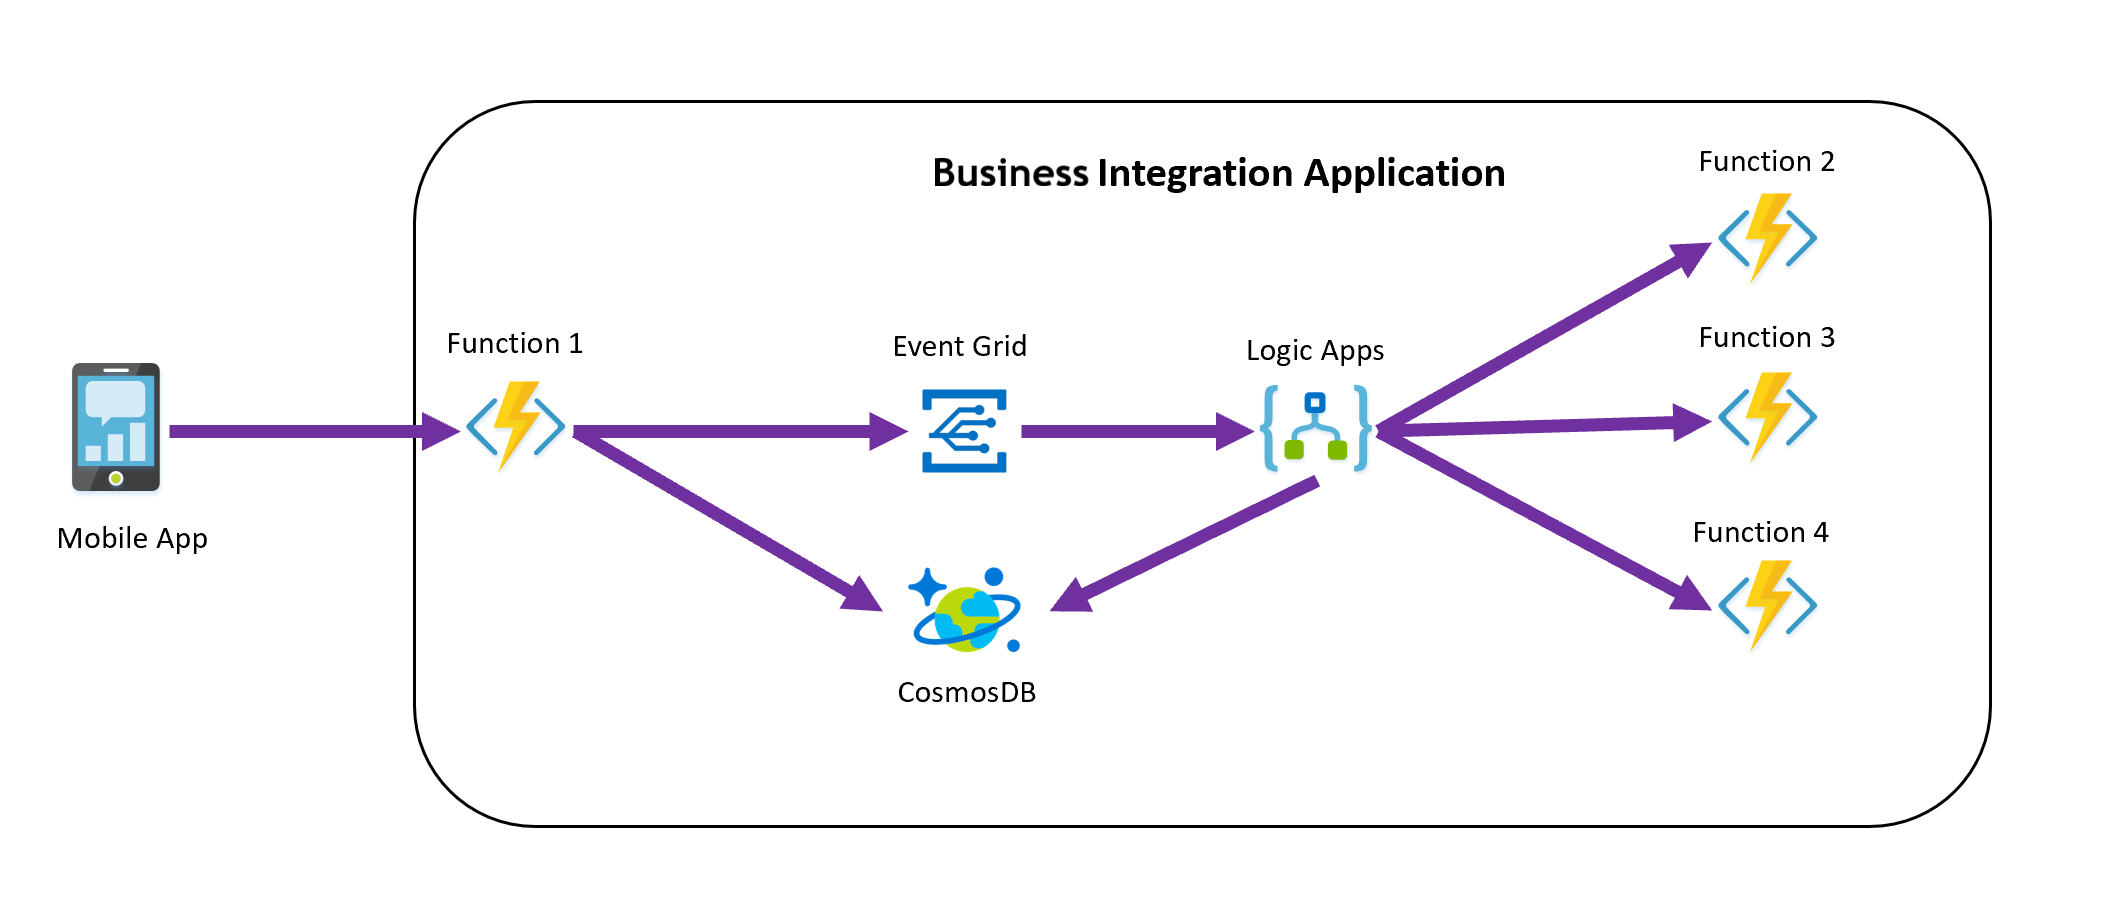
Service map is a visual diagramming tool in Business Applications that shows how the Azure resources within a Business Application relate to one another. It renders your application architecture as an interactive canvas, displaying each resource as an icon with its current health state.
When you build a line-of-business (LoB) application on Azure using PaaS services such as Logic Apps, Service Bus, Azure Functions, and Event Grid, the Azure portal manages those resources individually at the resource level. It does not provide an application-level view that reflects how those services work together. Service map fills that gap by letting you model the relationships between resources and monitor the health of the application as a whole.
.png)
Business value
Service map reduces the time it takes to identify the source of an application issue by surfacing the health of every resource in a single view. Instead of navigating between individual resources in the Azure portal, your team can see the full application topology and spot failures at a glance — shortening incident response and making architecture intent visible to everyone who works on the application.
How it works
Service map generates a default diagram automatically when you create a Business Application. Turbo360 arranges all associated resources as connected icons on a canvas within approximately five minutes of Business Application creation. Each icon reflects the resource's current monitoring state based on its configured monitoring rules.
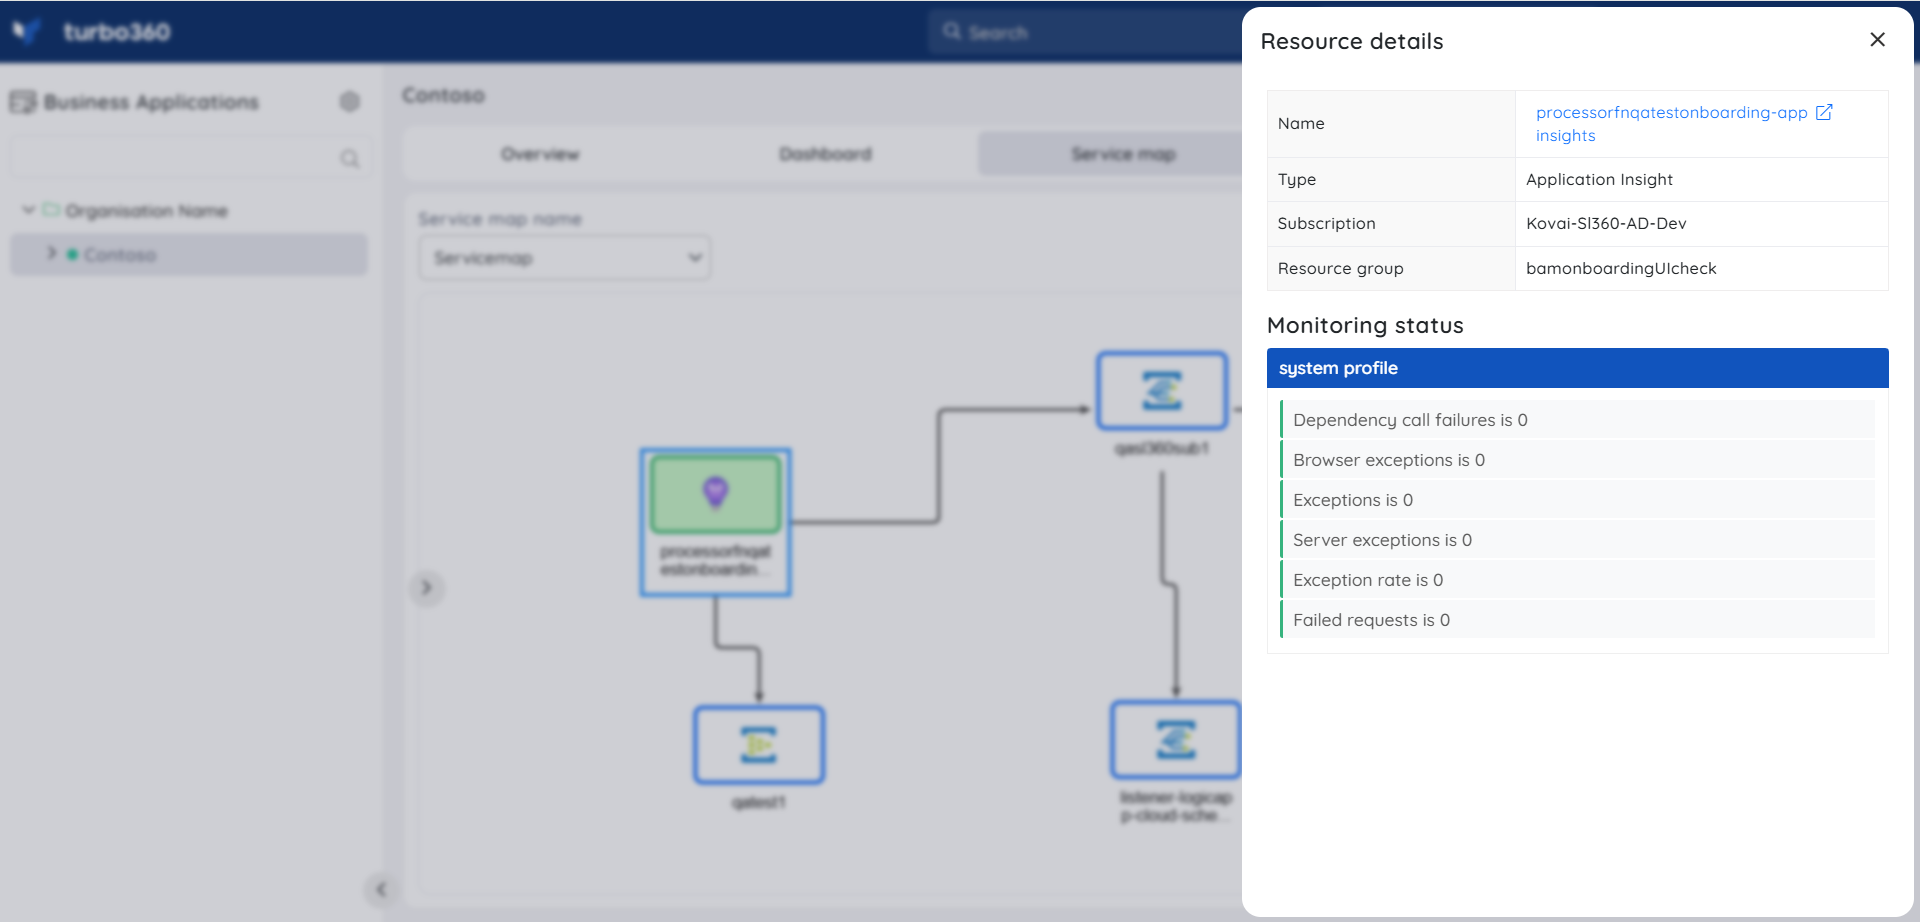
- Health status — each resource icon is colour-coded to show its current state: green (healthy), amber (warning), red (error), grey (to be monitored), or white (not monitored). Click any resource icon to open the resource details blade and view monitoring issues.
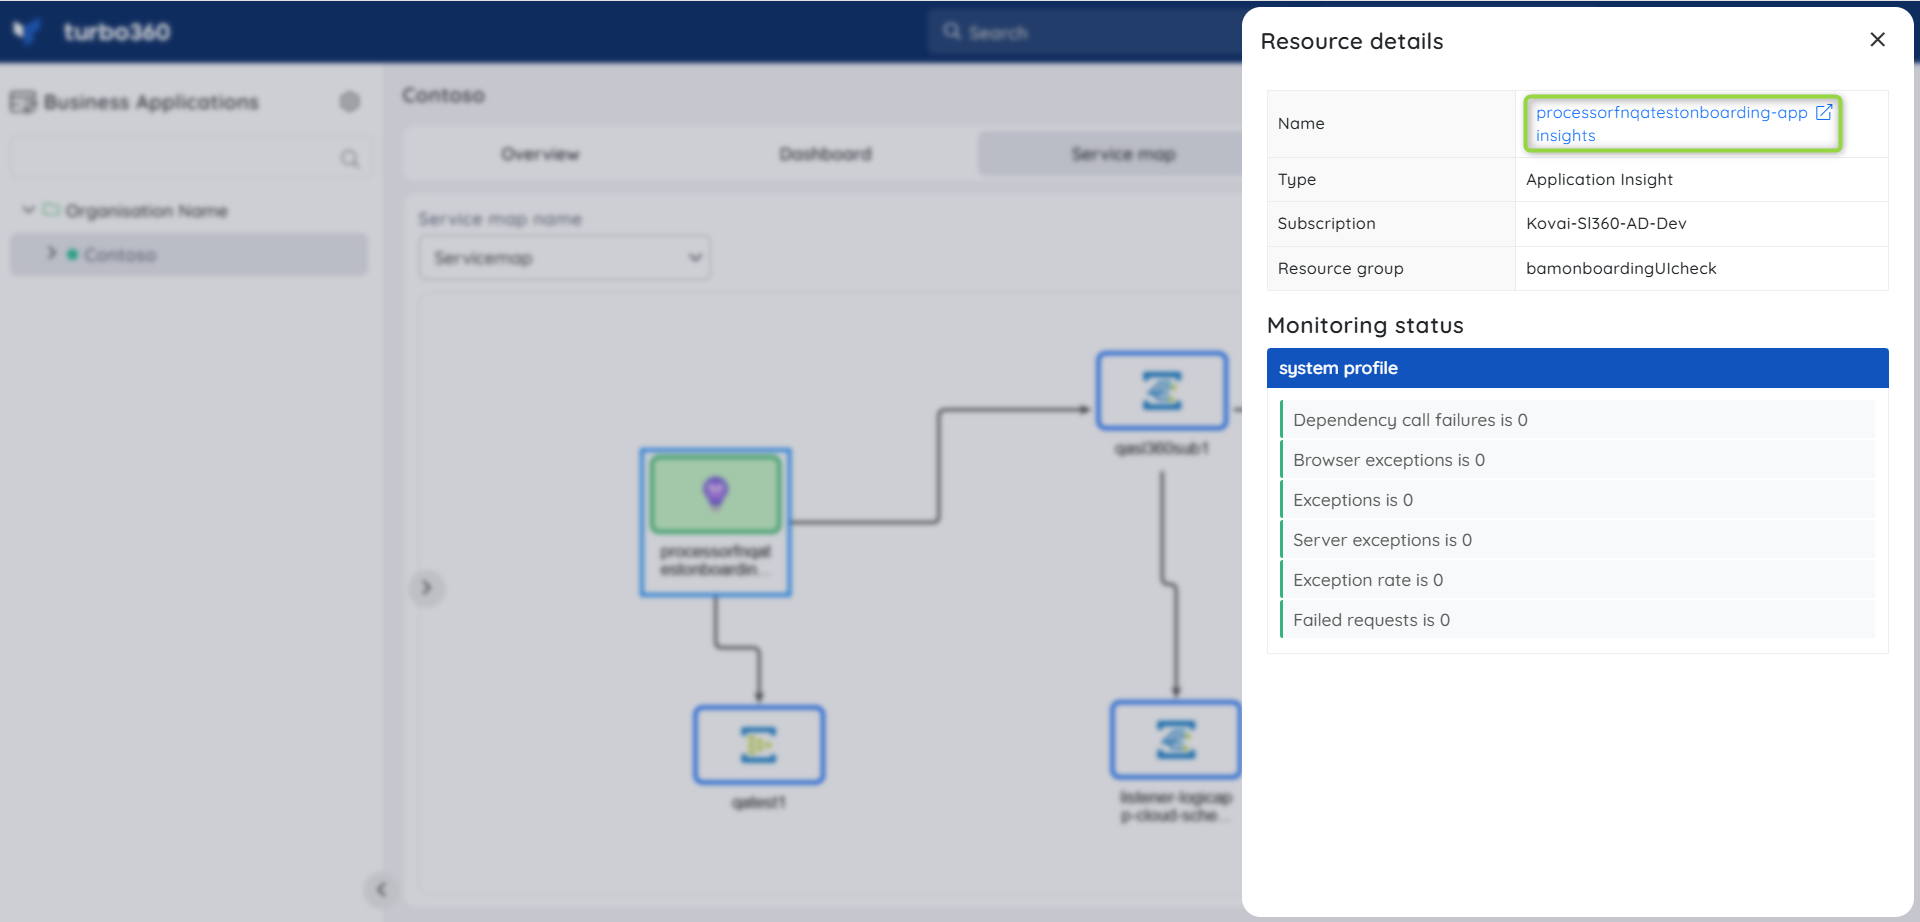
- Resource link — clicking the resource link in the resource details blade navigates you to that resource within the Business Application.
- Resource notes — you can add a personalised note to any resource icon directly on the canvas.
- Automatic updates — when a resource is added to or removed from a Business Application, all service maps in that application update automatically to reflect the change.
Note:
Resource links are not available for dissociated resources or for resources that do not have the required access.
Key characteristics
- Multiple service maps per Business Application — when an application contains several sub-orchestrations, you can create a separate service map for each. For example, a cab booking application might have distinct service maps for vehicle management, cab booking management, and driver onboarding management.
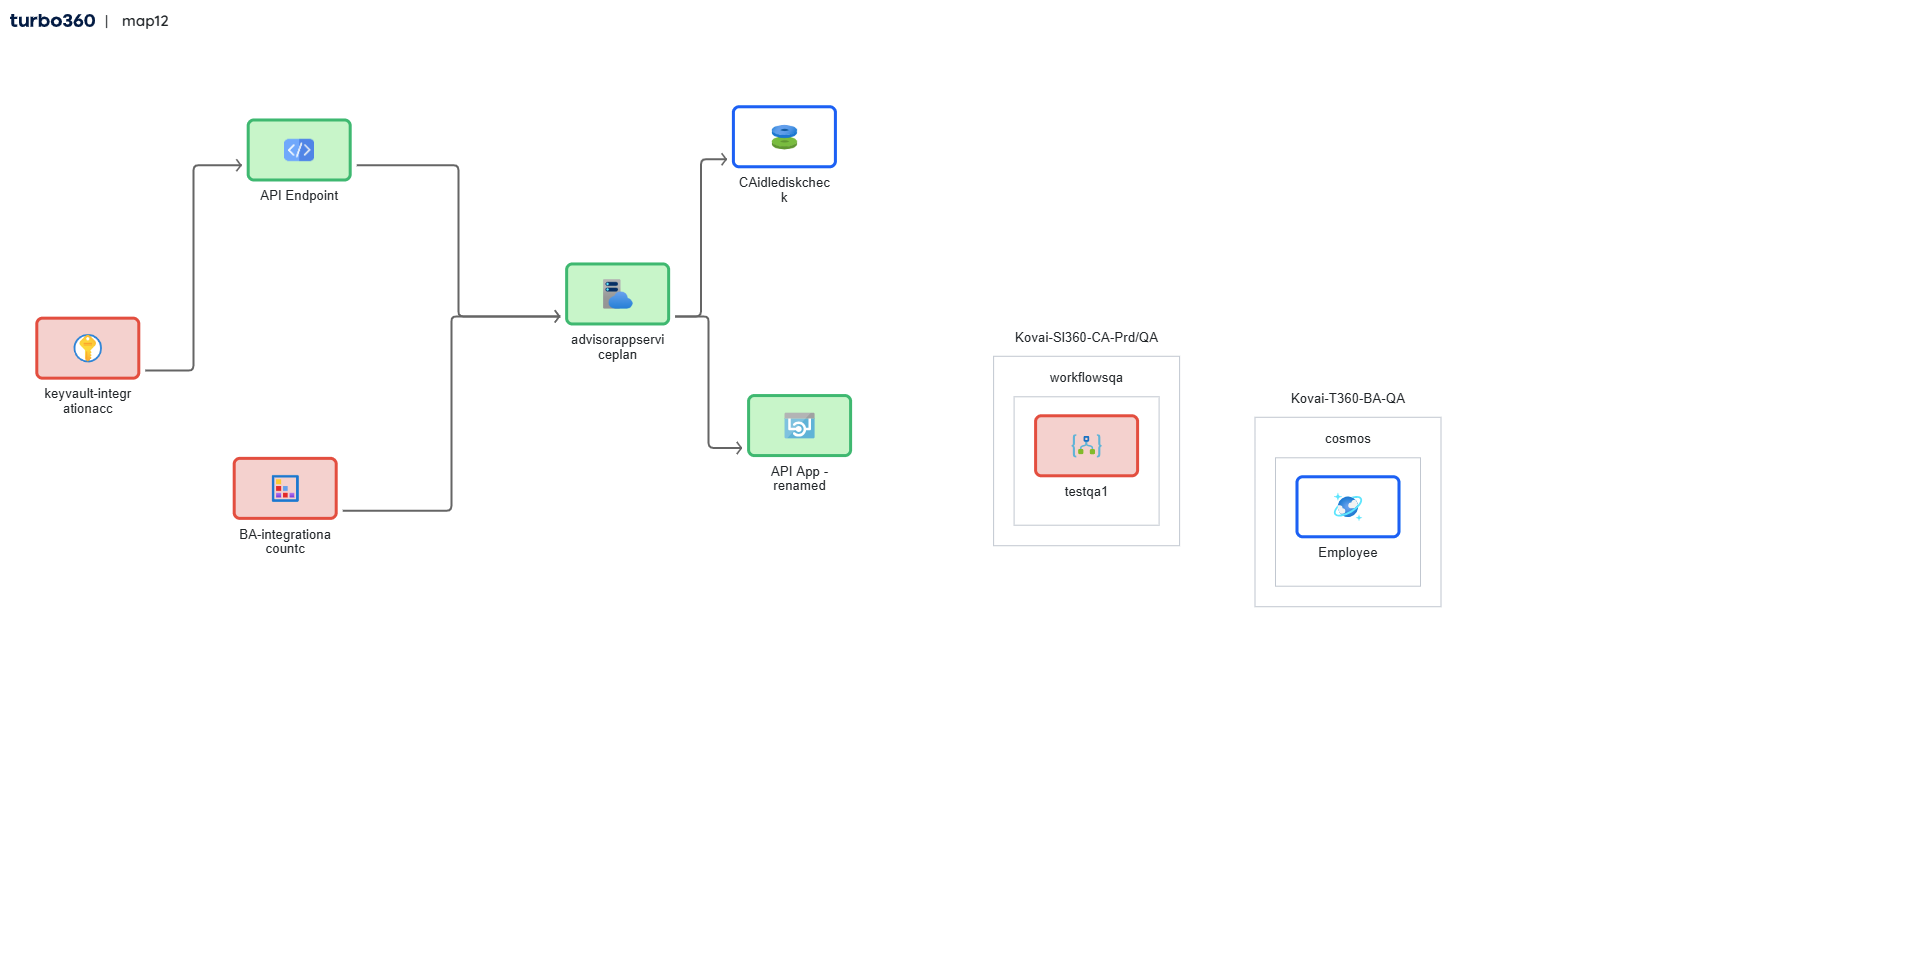
- Fullscreen display mode — you can view any service map in fullscreen to monitor resources without distractions. In fullscreen mode, you can toggle between Light mode and Dark mode.
- Grouping — resource icons on the canvas can be grouped to represent an inner orchestration layer within the broader architecture.
Light mode
Dark mode
.png)
Related articles
Was this article helpful?