Overview
Exception monitoring lets you receive real-time alerts whenever an exception is logged at any stage of a Push Model business transaction in Business Activity Monitoring (BAM). You can track exceptions across all transactions in a business process, filter by exception code or message, and configure separate notification rules for different teams.
Exception monitoring is exclusive to the Push Model (Custom Logging type). It captures exceptions recorded against BAM API events at the stage level and evaluates them against the alert rules you configure.
Business value
Exceptions in integration flows often indicate data quality issues, downstream service failures, or unexpected message formats. Exception monitoring surfaces these failures immediately, before they accumulate or trigger manual investigation, so your operations team can respond at the point of failure rather than discovering it in a post-incident review.
How it works
When you enable the Send alerts on exceptions in transactions option for a Push Model business process, BAM monitors every stage for logged exceptions. When an exception is detected, BAM evaluates it against your configured rules and sends an alert to the notification channels and email recipients you have specified.
You can control alert volume using the Max number of alerts and Duration settings, which cap how many alerts are sent within a given time window. Two alert configuration modes, basic and advanced, let you choose between a single shared channel for all exceptions or granular, per-exception-code routing.
Prerequisites
Required permissions
| Permission | Access level |
|---|---|
| View Exception monitor settings | Required to view exception monitoring configuration |
| Manage Exception monitor settings | Required to create or modify exception monitoring rules |
| Manage monitor settings | Required to enable or disable monitoring across all monitor types for a business process or business process group |
Steps
Use the following steps to configure exception monitoring for a Push Model business process. Navigate to Business Activity Monitoring > your business process > Monitoring to get started.
Enable exception alerts
Turn on exception alerting and set the alert volume limits before choosing a configuration mode.
- Select the Exception monitor tab (accessible under the Monitoring tab of your business process).
- Enable the Send alerts on exceptions in transactions checkbox.
- Optionally configure the following alert volume controls:
- Per transaction: applies the maximum alert count at the transaction level rather than the business process level. If one transaction reaches the maximum, other transactions continue sending alerts until they also reach the maximum.
- Per exception code: applies the maximum alert count per exception code. For example, with a max of 3 alerts per 10 minutes and 2 exception codes logged, up to 6 total alerts can be sent.
- Max number of alerts: the maximum number of alerts to send within the configured duration (1–100000).
- Duration: the period in minutes after which the alert count resets to 0. For example, a max of 3 alerts with a 10-minute duration means no more than 3 alerts are sent per 10-minute window.
- Note: an optional free-text label attached to this configuration. Shown on the monitoring tab for reference; does not affect alert evaluation.
Configure basic alert mode
Basic mode routes all exception alerts to a shared set of notification channels, regardless of exception code or message.
- Select Basic alert configuration.
- Select an Escalation policy if required. Escalation policy is only available in basic mode.
- Enter a Recipient email address and select an Email template.
- Under Notify the following notification channels, check each channel that should receive the alert.
- Click Update to save the configuration.
Configure advanced alert mode
Advanced mode lets you route alerts for specific exception codes or messages to different teams and channels.
- Select Advanced alert configuration.
- Add rules for each exception code or message you want to target. Set the exception type, value, and the notification channels for that rule.
- Alerts matching a rule are sent to that rule's channels. Exceptions that do not match any rule are handled by the default channel configuration.
- Optionally enter a Resolution note per rule. Each note is shown alongside the corresponding alert for that exception type.
Advanced alert configurations support Like and Not Like operators. To match a series of exception codes, for example, all 400-series codes, set the value to 4__.
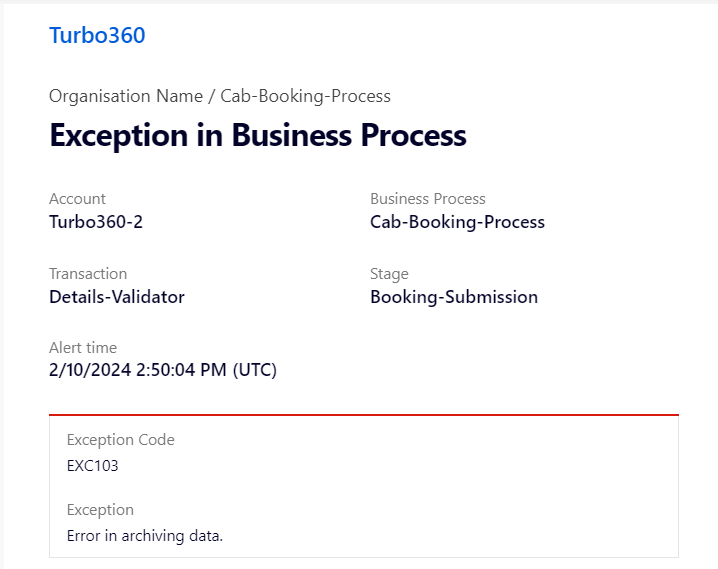
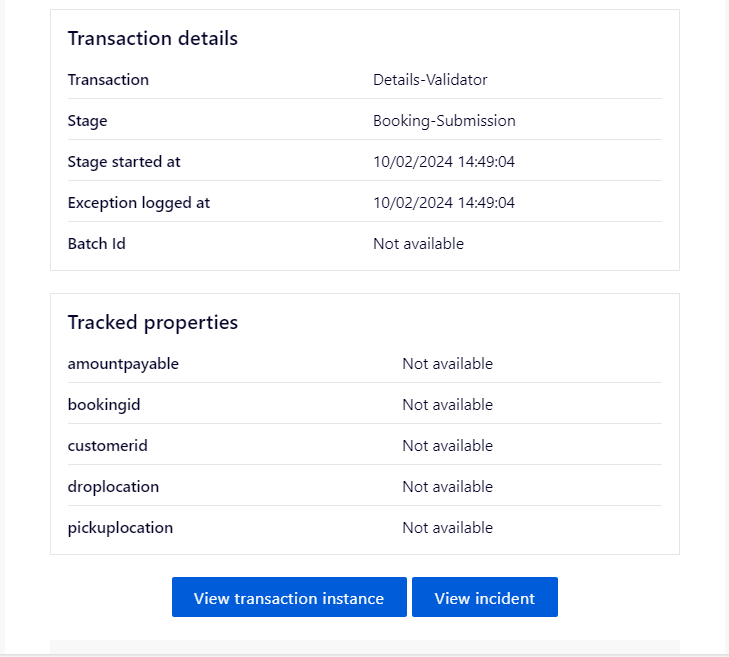
Examples of exception alerts received via email:
Configure custom messages
Custom messages let you attach a user-defined note to specific exception codes, exception messages, or message body values. The note appears in the Stage details blade and in exception alerts. See Custom messages for the full configuration steps, stage-level overrides, and troubleshooting.
Enable or disable monitoring
You can enable or disable all monitoring rules for a business process or business process group without deleting your configuration. This is useful for temporarily suspending alerting during maintenance or testing.
- Navigate to Business Activity Monitoring > your business process > Monitoring.
- In the top-right corner of the Monitoring view, open the Monitoring status dropdown.
- Select Enable to activate monitoring, or Disable to pause all monitoring rules for the business process.
Enabling and disabling monitoring requires the Manage monitor settings permission. This action affects all monitor types (Duration, Exception, and Query) for the selected business process simultaneously.
Configuration
| Option | Type | Description |
|---|---|---|
| Send alerts on exceptions in transactions | Toggle | Enables exception monitoring for the business process |
| Per transaction | Checkbox | Applies the max alert count at transaction level rather than business process level |
| Per exception code | Checkbox | Applies the max alert count per exception code |
| Max number of alerts | Integer (1–100000) | Maximum number of alerts to send within the duration window |
| Duration | Integer (minutes) | The window after which the alert count resets to 0 |
| Note | Text | Optional label shown on the monitoring configuration; does not affect alert evaluation |
| Alert configuration mode | Selection | Basic (shared channels) or Advanced (per-rule channels) |
| Escalation policy | Selection | Available in basic mode only |
| Resolution note | Text | Custom description attached to alert notifications in advanced mode |
| Monitoring status | Selection | Enable or Disable all monitoring rules for the business process |
Limitations
- Exception monitoring applies to the Push Model (Custom Logging type) only. It is not available for Pull Model (Data Queries) transactions.
- Escalation policy selection is available in basic alert configuration mode only.
- Advanced alert configurations using the Like / Not Like operators match against exception codes and messages but not message body values.
- When a custom message is defined globally and at the stage level, the stage-level message overrides the global one.
- Disabling monitoring via the Monitoring status dropdown suspends all monitor types for the business process, not only exception monitoring.
Troubleshooting
-
No alert received when an exception was logged
Cause: Exception monitoring may not be enabled, or the max alert limit for the current duration window has already been reached.
Fix: Open the Monitoring tab, confirm Monitoring status is set to Enabled, then verify the Send alerts on exceptions in transactions checkbox is enabled and the alert count has not been exhausted within the current window. -
More alerts than expected are being received
Cause: The Per transaction or Per exception code options expand the alert count independently per transaction or per exception type.
Fix: Review the Max number of alerts and Duration settings, and adjust the Per transaction and Per exception code options to reduce alert volume. -
Advanced mode rule is not matching the expected exception code
Cause: The value entered may not match the exact exception code format, or the operator may be incorrect.
Fix: Verify the exception code format in the Stage details blade and use the Like operator with a wildcard pattern (e.g.4__) if matching a series of codes. -
Escalation policy option is not available
Cause: The alert configuration mode is set to Advanced. Escalation policy is only available in basic mode.
Fix: Switch to basic alert configuration mode to access the escalation policy option. -
Custom message is not appearing in the alert
Cause: The exception type and value in the custom message may not match what is being logged at the stage.
Fix: Check the Stage details blade to confirm the exact exception code or message value, then update the custom message configuration to match. See Custom messages for full troubleshooting steps.
FAQs
-
Can I route different exception codes to different teams?
Yes. Use advanced alert configuration mode and create a rule per exception code or message, each with its own notification channels and recipients. -
What happens when both a global and a stage-level custom message are configured for the same exception?
The stage-level custom message overrides the global message for that specific stage. Other stages continue to use the global message. -
Does exception monitoring fire for every exception logged, or only the first one?
BAM sends alerts up to the configured Max number of alerts within the Duration window. After the limit is reached, alerts are suppressed until the window resets.