Overview
Query monitoring lets you track the results of saved queries against your Push Model business process data in Business Activity Monitoring (BAM) and receive alerts when the query results meet or exceed configured thresholds. You can monitor query output on a recurring schedule and route alerts to the appropriate teams through notification channels.
Query monitoring is also available in the Pull Model. For Pull Model query monitoring, see Query monitoring.
Business value
Many operational issues in integration environments become visible through patterns in tracked data, such as unusual volumes, missing records, or unexpected counts, before individual transactions start failing. Query monitoring lets you codify these signal patterns as saved queries and receive proactive alerts when the data deviates from expected ranges, reducing the time between anomaly and response.
How it works
Query monitoring works by running saved queries on a schedule, defined by the Rules evaluation frequency, and evaluating the result count against alert thresholds you configure. When the result exceeds the threshold, BAM sends an alert to your configured notification channels up to the Maximum alerts per hour limit.
You choose from existing saved queries in the Tracking section of a Push Model business process. Queries are evaluated independently, and each can have its own aggregation period, condition, warning and error thresholds, and notification channels in advanced mode.
Prerequisites
Required permissions
| Permission | Access level |
|---|---|
| View Query monitor settings | Required to view query monitoring configuration |
| Manage Query monitor settings | Required to create or modify query monitoring rules |
| Manage monitor settings | Required to enable or disable monitoring across all monitor types for a business process or business process group |
Steps
Use the following steps to configure query monitoring for a Push Model business process. Navigate to Business Activity Monitoring > your business process > Monitoring to get started.
Configure alert settings
Set the evaluation schedule and alert rate limit before adding queries.
- Select the Query monitor tab (accessible under the Monitoring tab of your business process).
- Set the Rules evaluation frequency: the interval at which BAM retrieves records and evaluates them against your thresholds. For example, setting this to 15 minutes causes the query monitor to check the last 15 minutes of tracked data every 15 minutes.
- Set the Maximum alerts per hour: the maximum number of alerts BAM sends per hour, regardless of how many threshold violations occur.
Choose the alert configuration mode
Query monitoring supports two alert configuration modes.
Basic alert configuration: all selected queries share the same notification channels and email recipients. You can assign an escalation policy in this mode.
Advanced alert configuration: notification channels, thresholds, and aggregation periods are configured individually for each query.
Configure basic alert configuration
- Select Basic alert configuration.
- Select an Escalation policy if required. Escalation policy is only available in basic mode.
- Enter a Recipient email address and select an Email template.
- Under Select the channels, check each notification channel that should receive the alert.
- Click Update to save the configuration.
Add saved queries (advanced alert configuration)
In advanced mode, each query is configured as an individual rule with its own thresholds and notification routing.
- Select Advanced alert configuration.
- Click + Add query.
- Select a saved query from the query library displayed in the configuration for the business process.
- Set the Aggregation period: the time window BAM uses to evaluate the query results.
- Set the Condition: the operator used to compare the query result count against the thresholds (for example,
>). - Set the Warning threshold: BAM fires a warning alert when the query result count meets this condition.
- Set the Error threshold: BAM fires an error alert when the query result count meets this condition.
- Optionally enter a Note: shown on the query rule for reference.
- Configure the Notification channels for this query rule.
- Click Update to save.
- Queries added in the Query monitor section are not available in the Tracking section of the corresponding business process.
- Advanced queries saved in the Tracking section of a business process are not listed for query monitoring.
Once enabled, the query monitor runs according to the rules evaluation frequency and sends alerts up to the maximum alerts per hour limit.
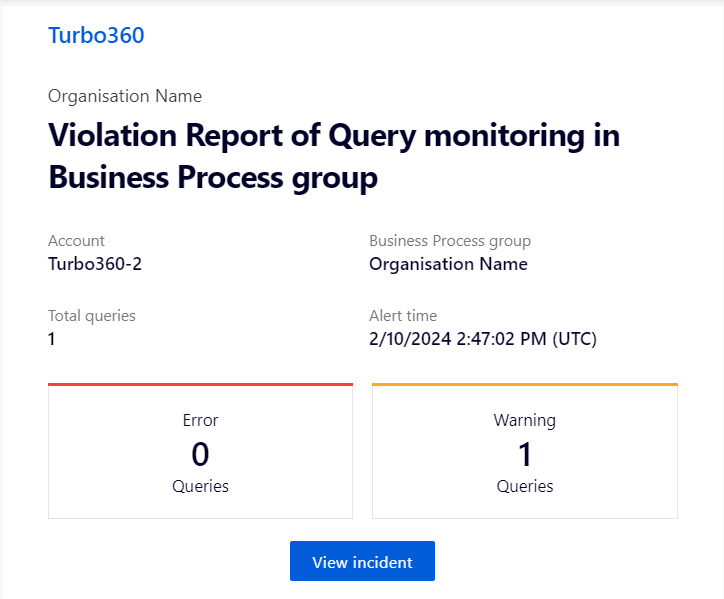
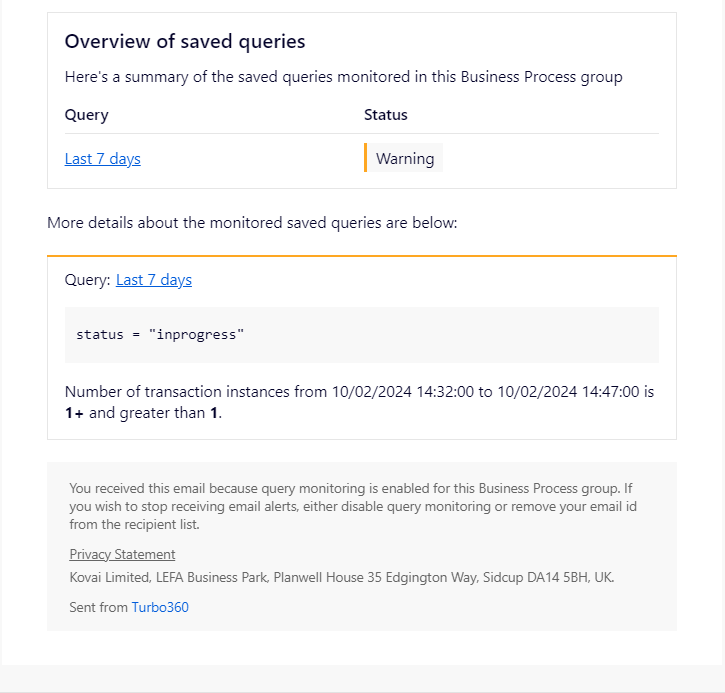
Sample query alerts received via email:
Enable or disable monitoring
You can enable or disable all monitoring rules for a business process or business process group without deleting your configuration. This is useful for temporarily suspending alerting during maintenance or testing.
- Navigate to Business Activity Monitoring > your business process > Monitoring.
- In the top-right corner of the Monitoring view, open the Monitoring status dropdown.
- Select Enable to activate monitoring, or Disable to pause all monitoring rules for the business process.
Enabling and disabling monitoring requires the Manage monitor settings permission. This action affects all monitor types (Duration, Exception, and Query) for the selected business process simultaneously.
Configuration
| Option | Type | Description |
|---|---|---|
| Rules evaluation frequency | Selection | How often BAM evaluates the saved queries against tracked data |
| Maximum alerts per hour | Integer | Cap on alerts sent per hour across all monitored queries |
| Alert configuration mode | Selection | Basic (shared channels) or Advanced (per-query channels) |
| Escalation policy | Selection | Available in basic mode only; escalates unresolved alerts after a defined interval |
| Aggregation period | Selection | Time window used to evaluate query result counts; configurable per query in advanced mode |
| Condition | Selection | Operator used to compare query result count against thresholds (e.g. >) |
| Warning threshold | Integer | Query result count at which a warning alert fires |
| Error threshold | Integer | Query result count at which an error alert fires |
| Note | Text | Optional label shown on the query rule; does not affect evaluation |
| Monitoring status | Selection | Enable or Disable all monitoring rules for the business process |
Limitations
- Advanced queries saved in the Tracking section of a business process are not listed for query monitoring. Only standard saved queries are available.
- Queries added in the Query monitor section do not appear in the Tracking section of the business process.
- Escalation policy assignment is available in basic alert configuration mode only.
- Disabling monitoring via the Monitoring status dropdown suspends all monitor types for the business process, not only query monitoring.
Troubleshooting
-
A saved query does not appear in the Add query list
Cause: The query may be an advanced query saved in the Tracking section. Advanced queries are not available for query monitoring.
Fix: Use only standard saved queries from the Tracking section. Convert the query to a standard saved query if needed. -
No alert was received after the evaluation frequency elapsed
Cause: The query monitor may not be enabled, or the query result did not meet the threshold.
Fix: Open the Monitoring tab, confirm Monitoring status is set to Enabled, then verify the query monitor is active and the configured threshold matches the expected query result volume. -
Alert volume is too high
Cause: The Maximum alerts per hour limit may be set too high, or multiple queries are matching frequently.
Fix: Lower the Maximum alerts per hour value or adjust the query threshold to reduce false positives. -
Escalation policy option is not visible
Cause: The alert configuration mode is set to Advanced. Escalation policy is only available in basic mode.
Fix: Switch to basic alert configuration mode to access the escalation policy option. -
Resolution note is not appearing in the alert
Cause: The resolution note may not have been saved, or the alert was generated by a query that does not have a resolution note configured.
Fix: Open the query monitor configuration, confirm the note is entered for the relevant query rule, and save the configuration.
FAQs
-
Can I monitor queries from multiple business processes in a single query monitor?
No. Query monitoring is configured per business process. Each business process has its own query monitor with its own saved queries and settings. -
Can I assign different notification channels to different queries?
Yes. Switch to advanced alert configuration mode to configure notification channels and email recipients individually for each query. -
What is the difference between Rules evaluation frequency and Maximum alerts per hour?
Rules evaluation frequency controls how often BAM checks your data, for example, every 15 minutes. Maximum alerts per hour limits how many alert notifications BAM actually sends within an hour, regardless of how many threshold violations the evaluation finds.